Analysis
- Source:OECD Organisation for Economic Co-operation and Development
- 多重共線性は確認していない。
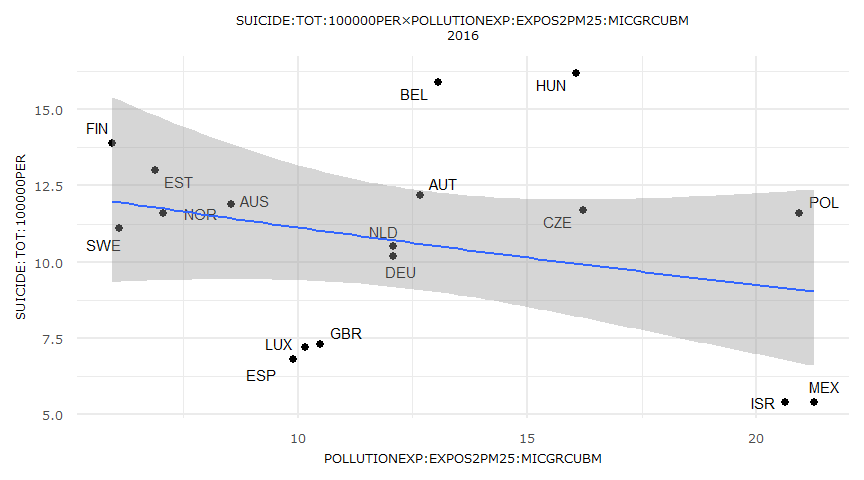
- 対象年:2016
MODEL INFO:
Observations: 18
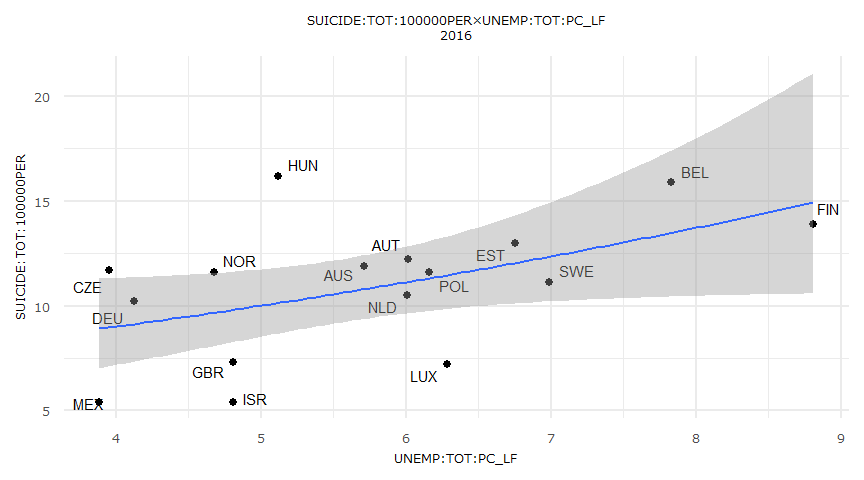
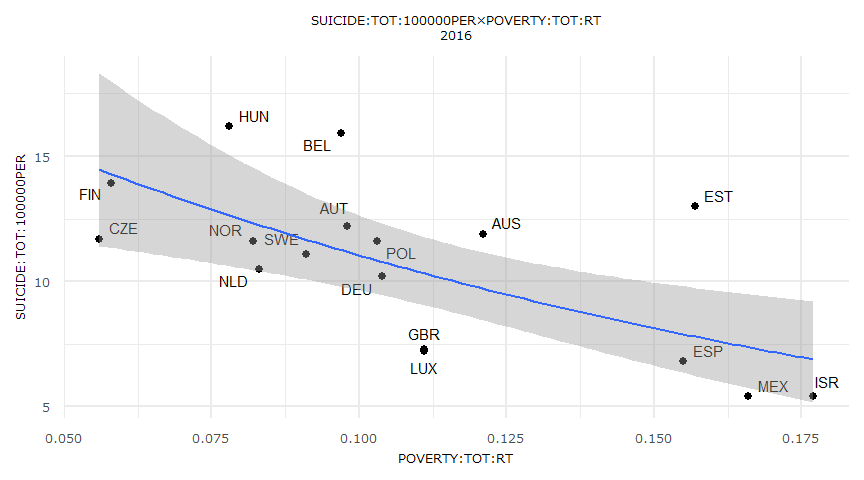
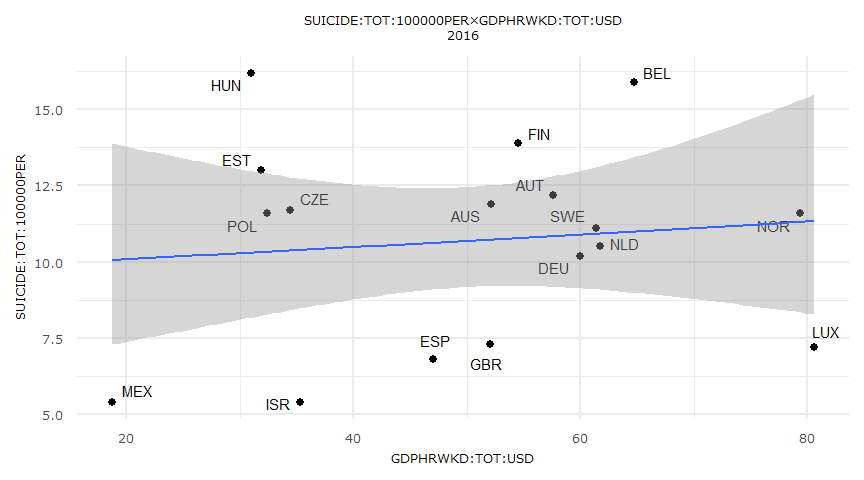
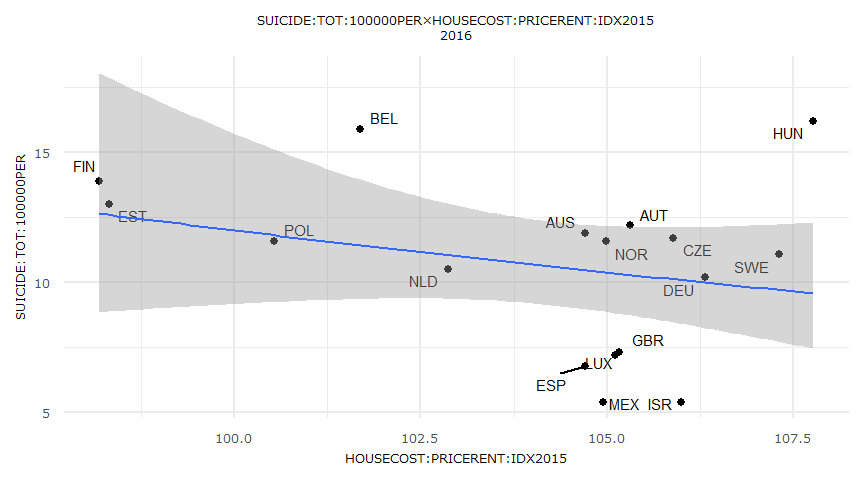
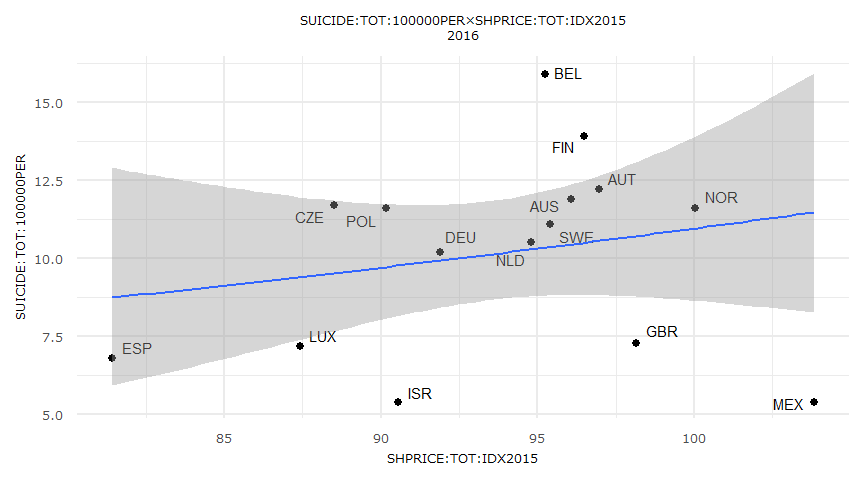
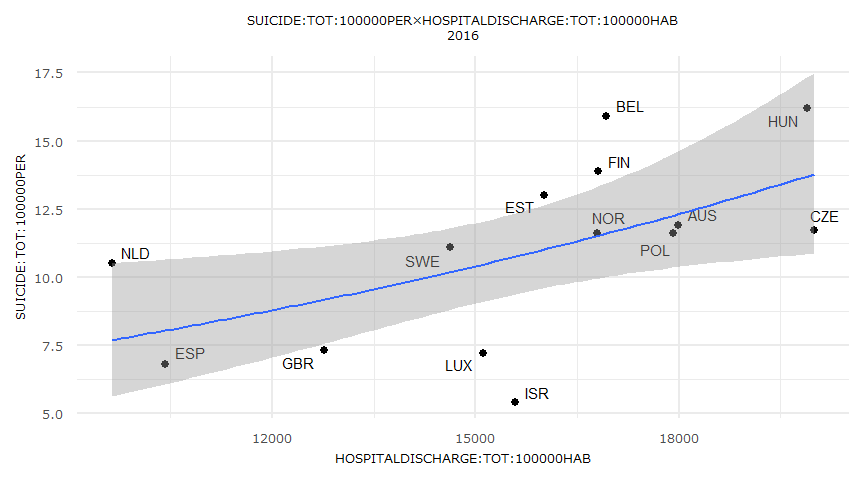
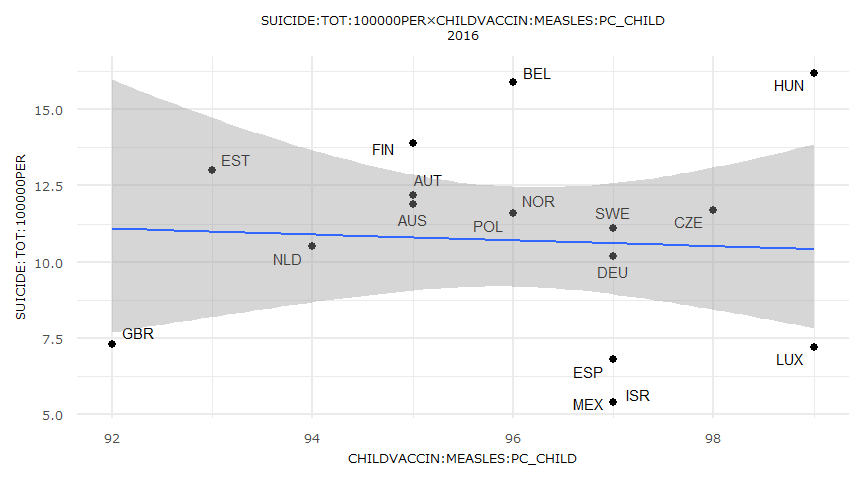
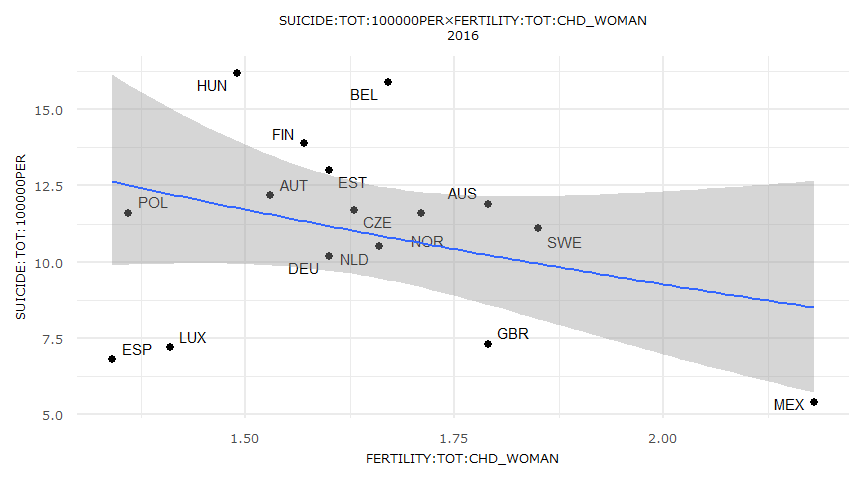
Dependent Variable: SUICIDE:TOT:100000PER
Type: Generalized linear model
Family: Gamma
Link function: log
MODEL FIT:
χ2(9) = 1.94, p = 0.00
Pseudo-R2 (Cragg-Uhler) = 0.76
Pseudo-R2 (McFadden) = 0.25
AIC = 98.74, BIC = 108.54
Standard errors: MLE
---------------------------------------------------------------------------------
Est. 2.5% 97.5% t val. p
----------------------------------------- ------- ------- ------- -------- ------
(Intercept) 4.35 -3.70 12.41 1.06 0.32
UNEMP:TOT:PC_LF -0.01 -0.06 0.05 -0.23 0.83
POVERTY:TOT:RT -1.16 -5.93 3.61 -0.48 0.65
GDPHRWKD:TOT:USD 0.00 -0.01 0.02 0.56 0.59
HOUSECOST:PRICERENT:IDX2015 -0.06 -0.12 -0.00 -2.00 0.08
SHPRICE:TOT:IDX2015 0.01 -0.00 0.03 1.48 0.18
HOSPITALDISCHARGE:TOT:100000HAB 0.00 -0.00 0.00 1.62 0.14
CHILDVACCIN:MEASLES:PC_CHILD 0.03 -0.07 0.13 0.63 0.55
FERTILITY:TOT:CHD_WOMAN -0.31 -0.75 0.13 -1.38 0.20
POLLUTIONEXP:EXPOS2PM25:MICGRCUBM 0.01 -0.04 0.06 0.43 0.68
---------------------------------------------------------------------------------
Estimated dispersion parameter = 0.08
- 個別系列毎のGLM。
- 外れ値は除外している。
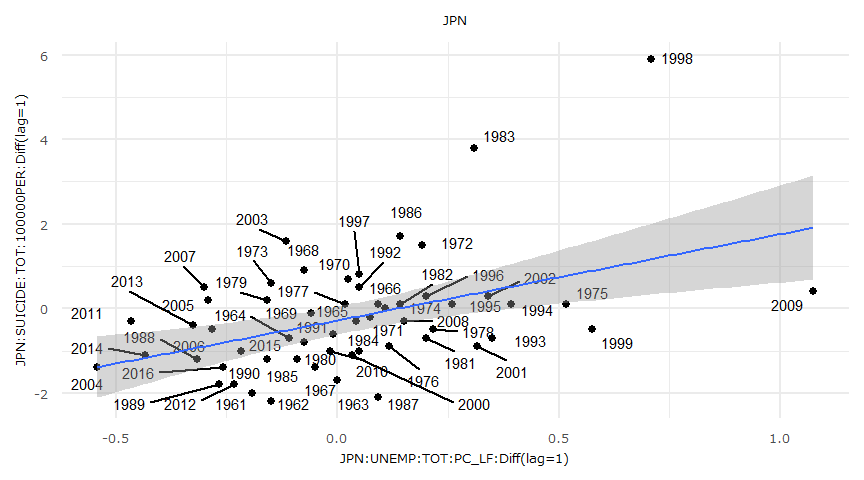
lmresult <- lm(formula = tsdata$`JPN:SUICIDE:TOT:100000PER:Diff(lag=1)` ~ tsdata$`JPN:UNEMP:TOT:PC_LF:Diff(lag=1)`)
$`JPN:UNEMP:TOT:PC_LF:Diff(lag=1)`

    Augmented Dickey-Fuller Test

data:  na.omit(x)
Dickey-Fuller = -3.5763, Lag order = 3, p-value = 0.04318
alternative hypothesis: stationary


$`JPN:SUICIDE:TOT:100000PER:Diff(lag=1)`

    Augmented Dickey-Fuller Test

data:  na.omit(x)
Dickey-Fuller = -3.264, Lag order = 3, p-value = 0.08632
alternative hypothesis: stationary
MODEL INFO:
Observations: 56
Dependent Variable: tsdata$`JPN:SUICIDE:TOT:100000PER:Diff(lag=1)`
Type: OLS linear regression

MODEL FIT:
F(1,54) = 13.13, p = 0.00
R2 = 0.20
Adj. R2 = 0.18

Standard errors: OLS
--------------------------------------------------------------------------------------
                                                  Est.    2.5%   97.5%   t val.      p
---------------------------------------------- ------- ------- ------- -------- ------
(Intercept)                                      -0.28   -0.61    0.05    -1.69   0.10
tsdata$`JPN:UNEMP:TOT:PC_LF:Diff(lag=1)           2.04    0.91    3.17     3.62   0.00
--------------------------------------------------------------------------------------
    Durbin-Watson test

data:  summary(lmresult)
DW = 1.9801, p-value = 0.4456
alternative hypothesis: true autocorrelation is greater than 0
    One-sample Kolmogorov-Smirnov test

data:  lmresult$residuals
D = 0.1169, p-value = 0.3978
alternative hypothesis: two-sided
    studentized Breusch-Pagan test

data:  lmresult
BP = 7.5477, df = 1, p-value = 0.006009
    Box-Ljung test

data:  lmresult$residuals
X-squared = 0.00058759, df = 1, p-value = 0.9807