米国主要株価指数と米国債利回りで確認する米国市場のセンチメント, etc.
Updated time:2020-04-21 06:30:48
米国主要株価指数と米国債利回りで確認する米国市場のセンチメント
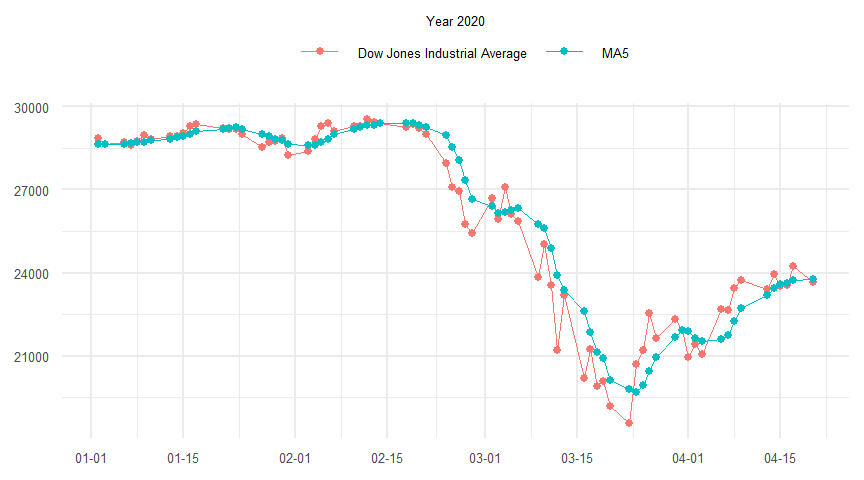
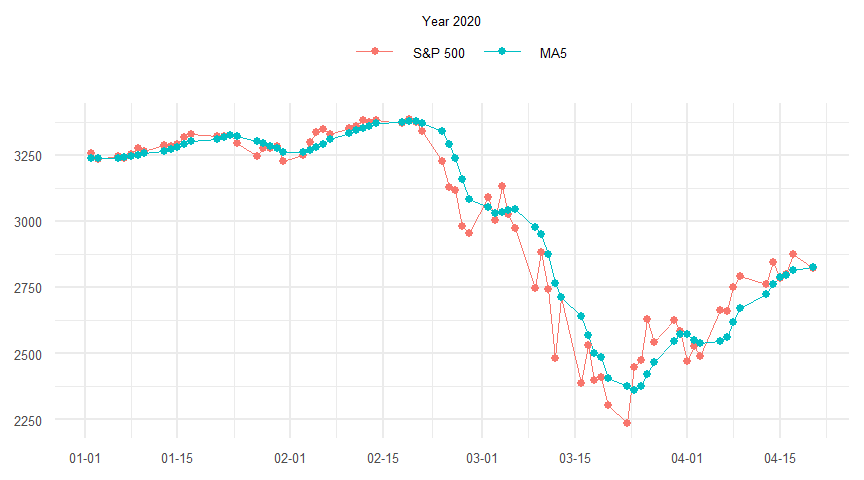
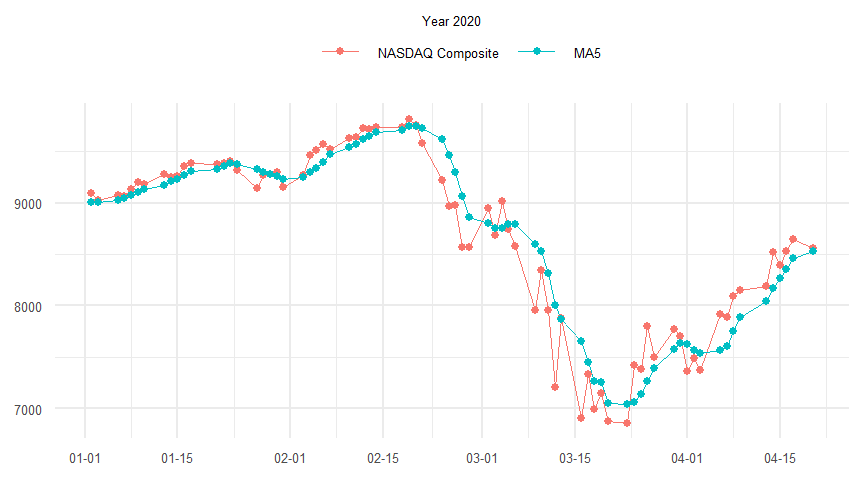
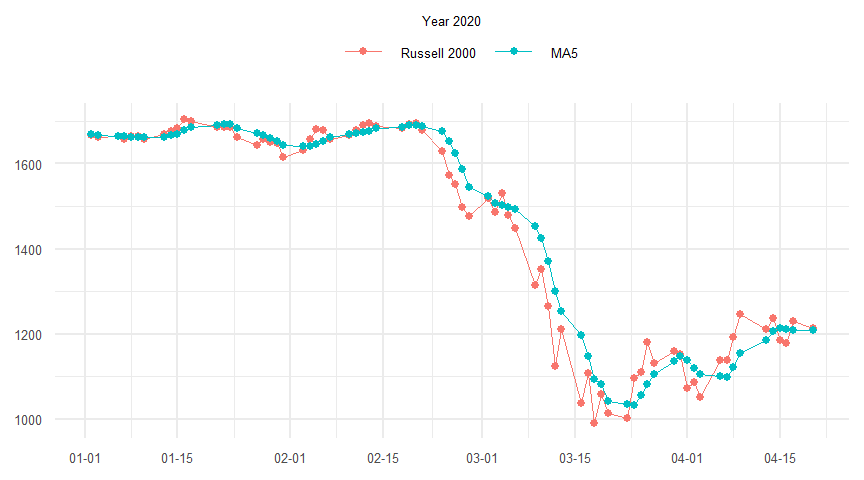
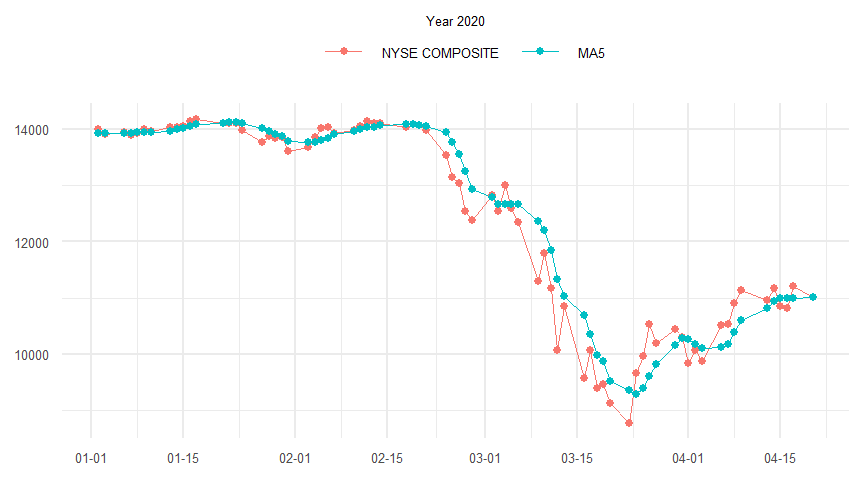
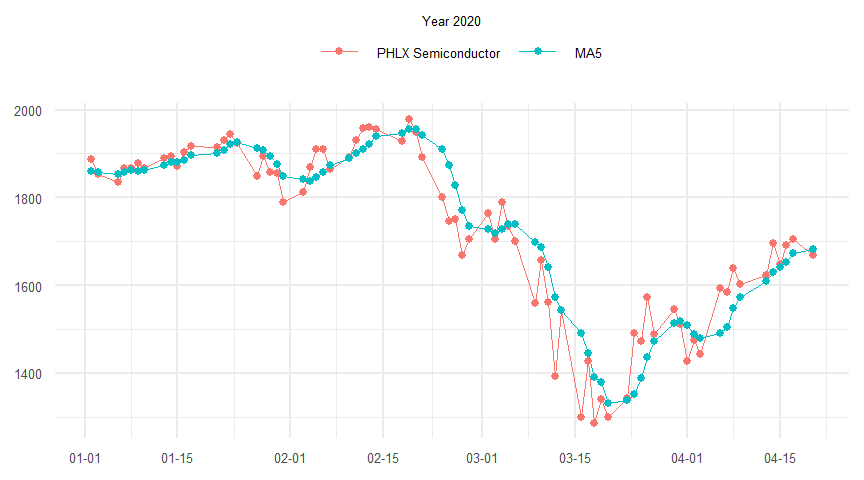
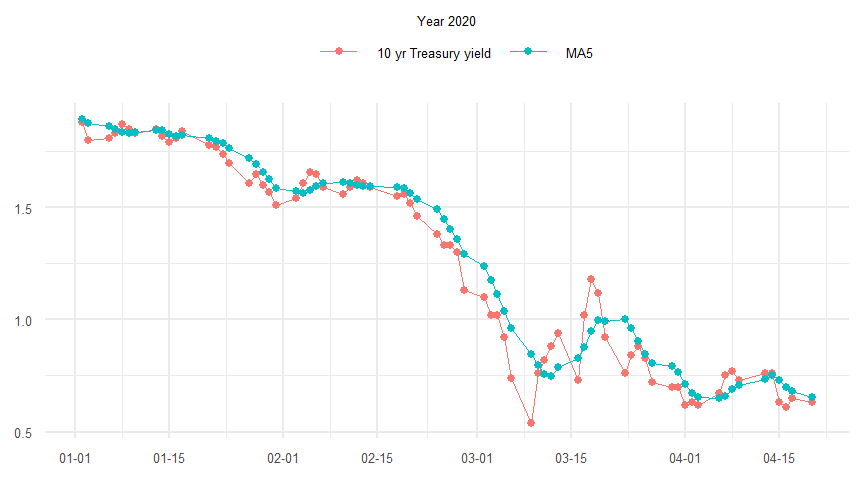
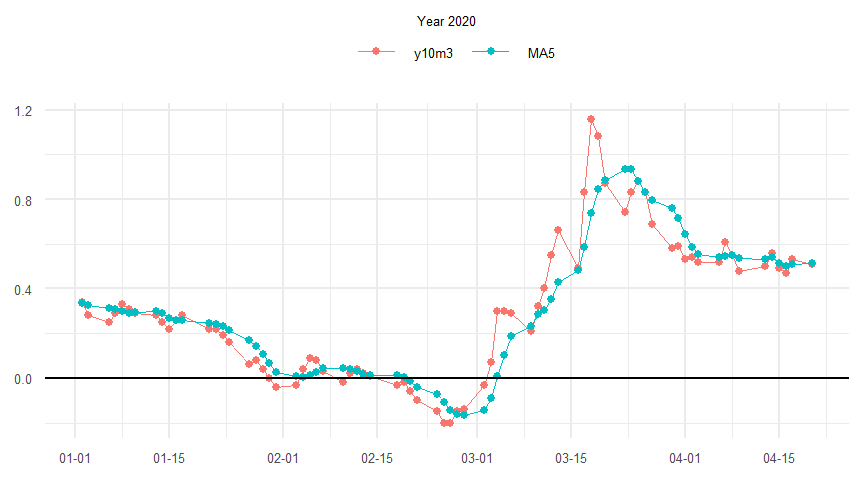
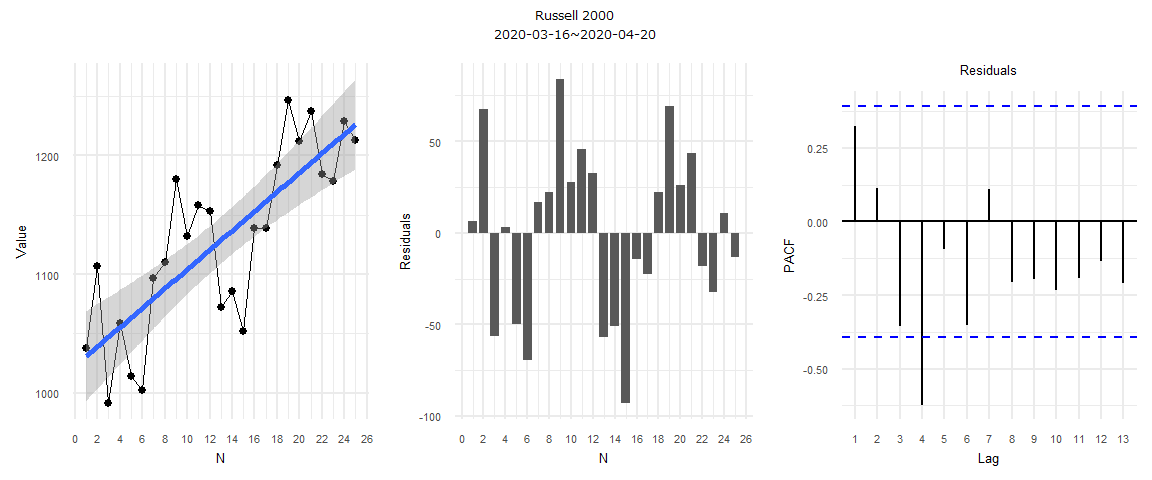
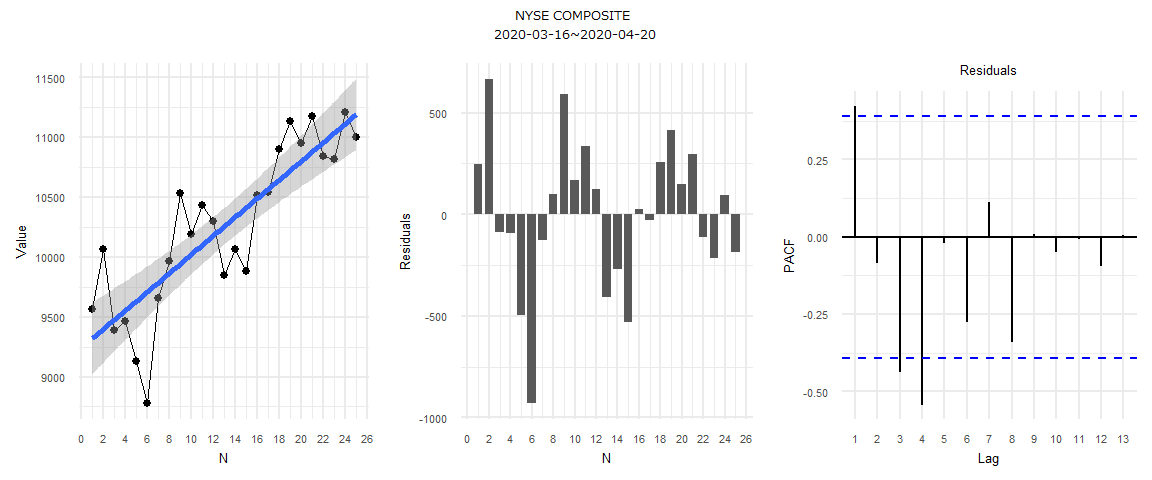
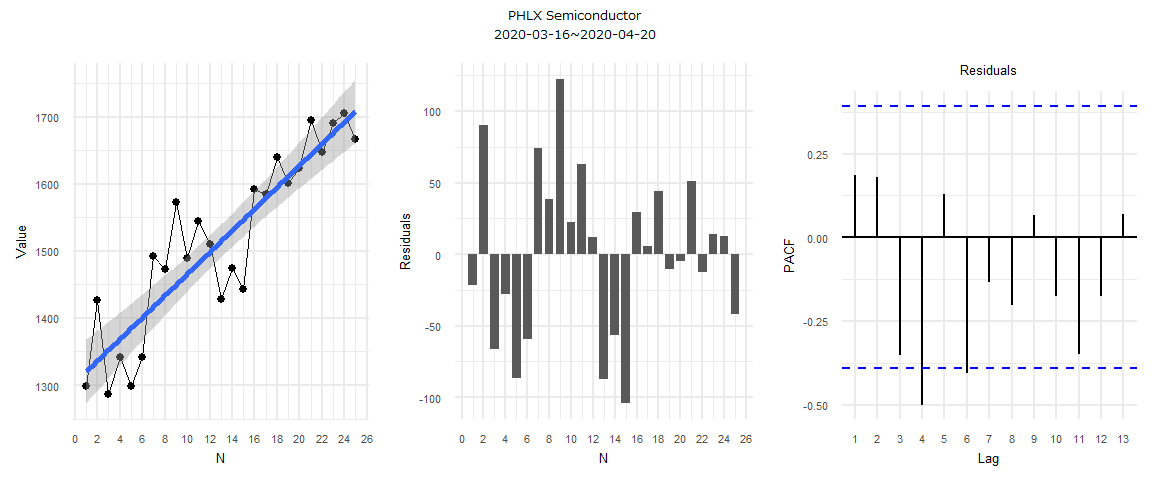
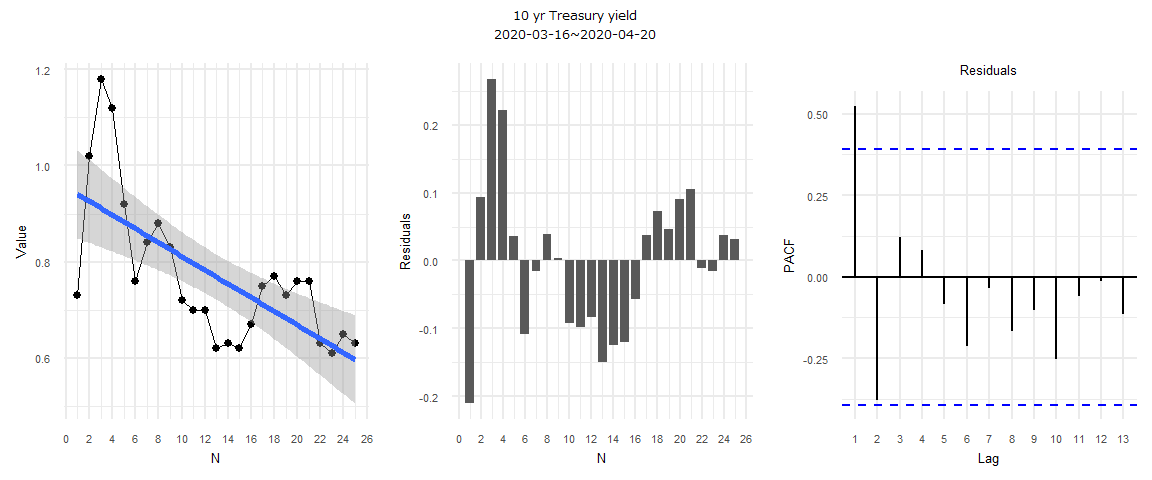
2020年04月20日(月曜日)の米国主要株式6指数(DJI、GSPC、IXIC、RUT、NYA、SOX)は前日比上昇が0、同下落は6、同変わらずが0。日足陽線は1、同陰線が5、寄引同時は0。米国債10年物名目利回りは低下(0.65→0.63)。
- 2020年04月20日の前営業日比(%):Dow Jones Industrial Average:-2.44、S&P 500:-1.79、NASDAQ Composite:-1.03、Russell 2000:-1.28、NYSE COMPOSITE :-1.82、PHLX Semiconductor:-2.23
指数値、利回りテーブル
- 直近6営業日分
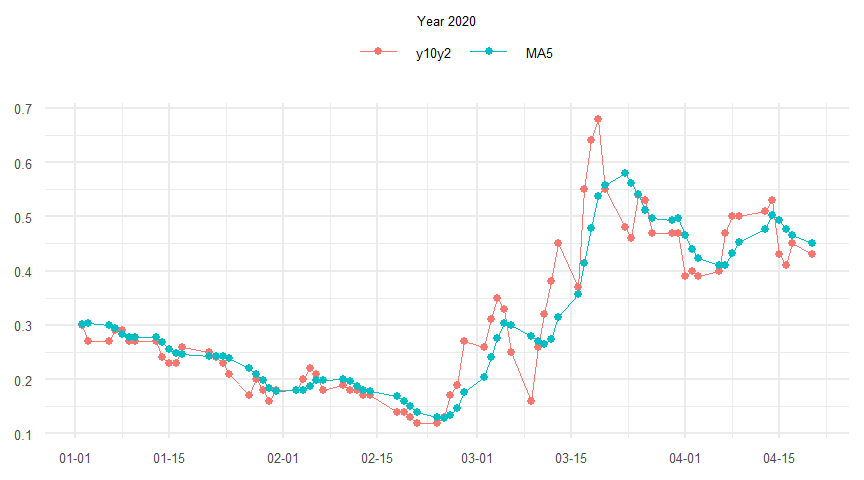
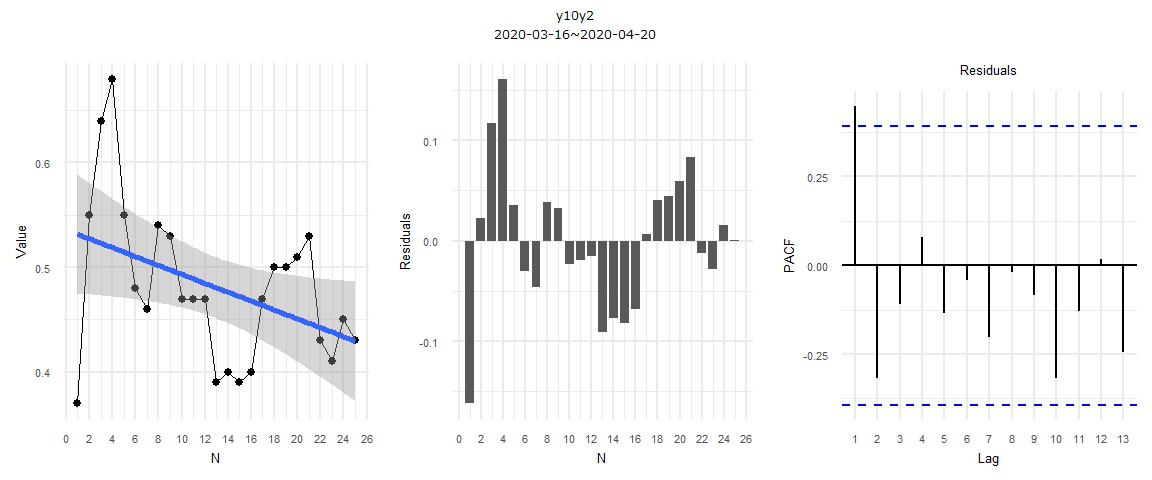
- y10y2:10年物と2年物の利回り差(pp)
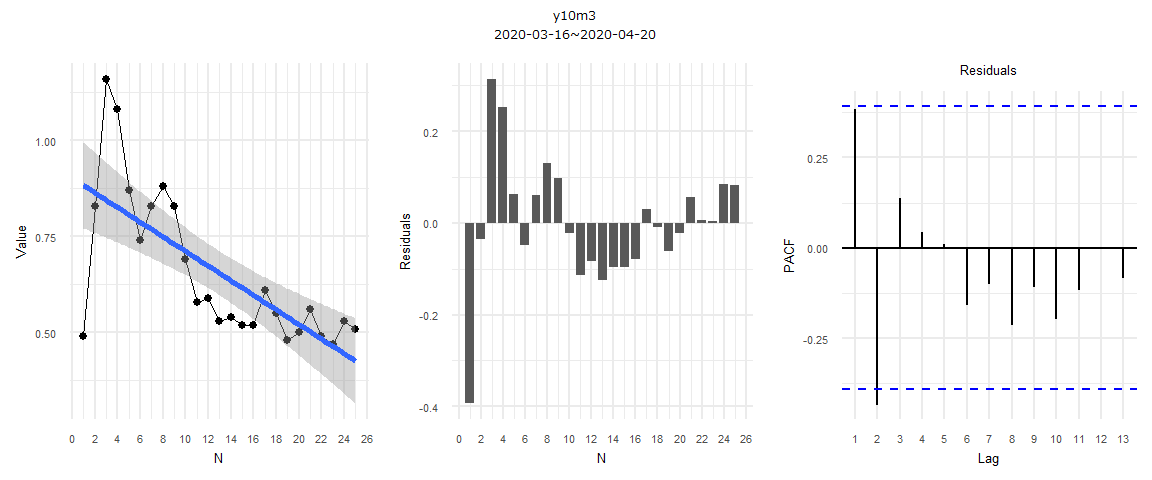
- y10m3:10年物と3ヶ月物の利回り差(pp)
- 米国主要株価指数
- 米国債利回り
- 年初来最高値
- 年初来最安値
- 年初比(%)
- 年初比
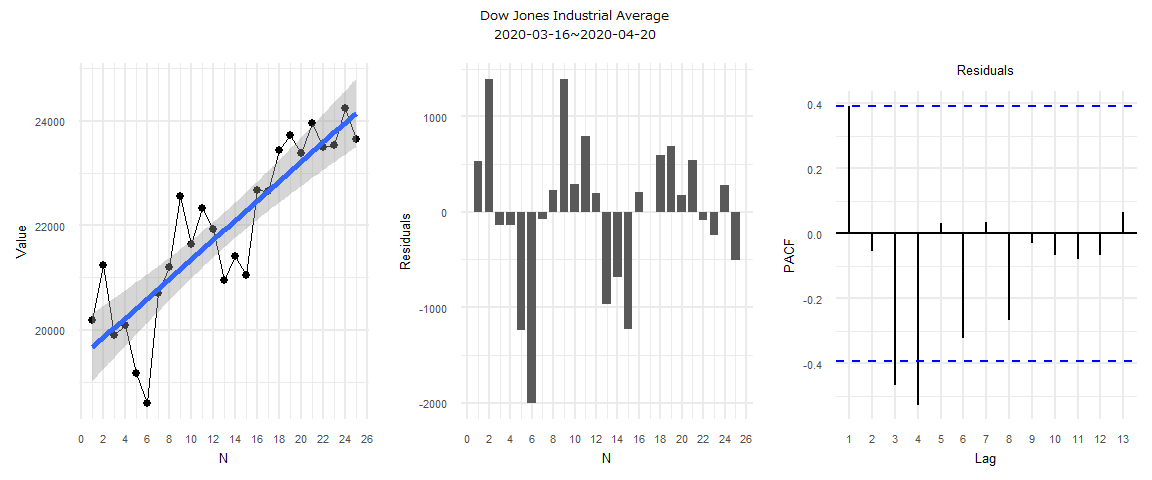
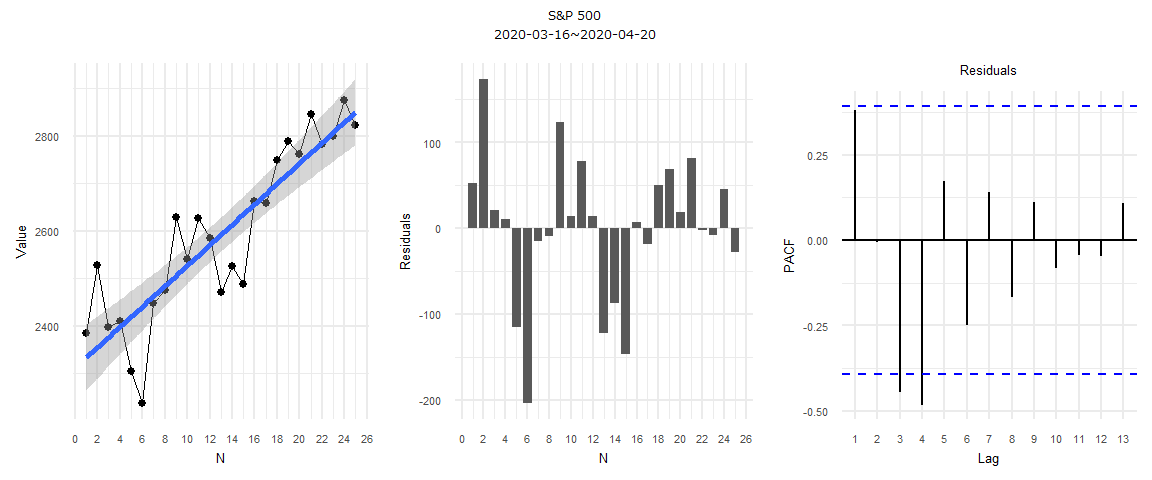
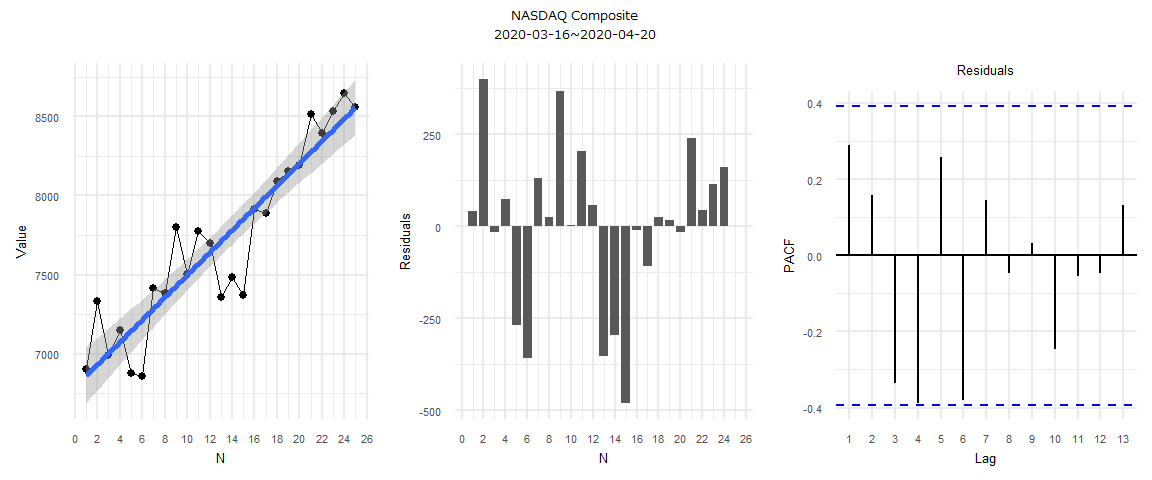
参考計量分析
- 線形回帰、偏自己相関関数
- 説明変数をx={1,2,…,25}、応答変数をy={終値}とした線形回帰の結果一覧。“r squared”以外は全てp値。
- Durbin-Watson、Kolmogorov-Smirnov、Breusch-Pagan、Ljung-Boxは全て残差に対する検定。
日経平均株価と東京市場ドル円レート
- Source:日本銀行,日本経済新聞社
分析設計
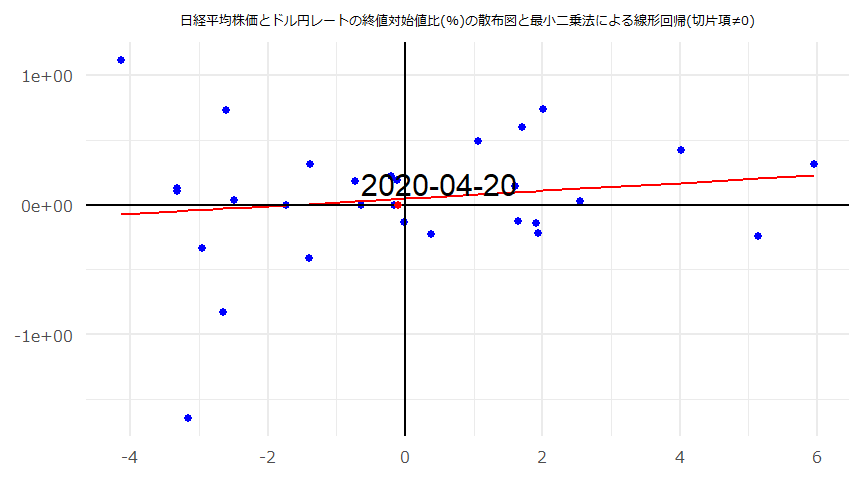
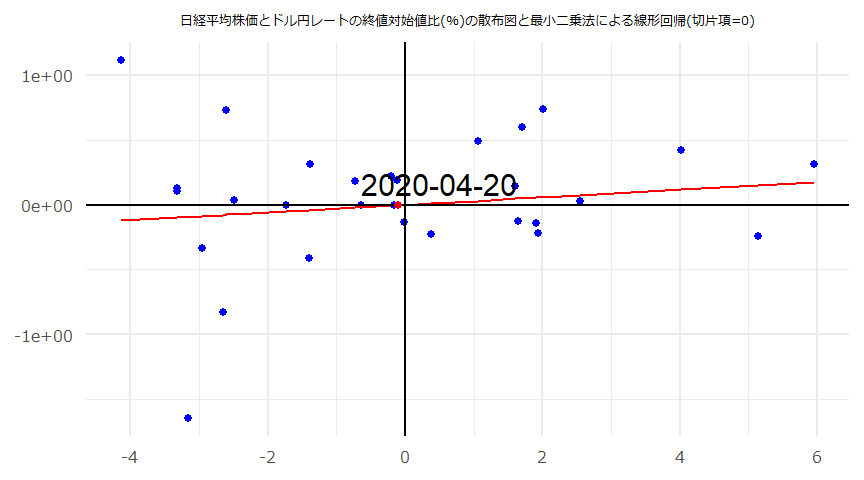
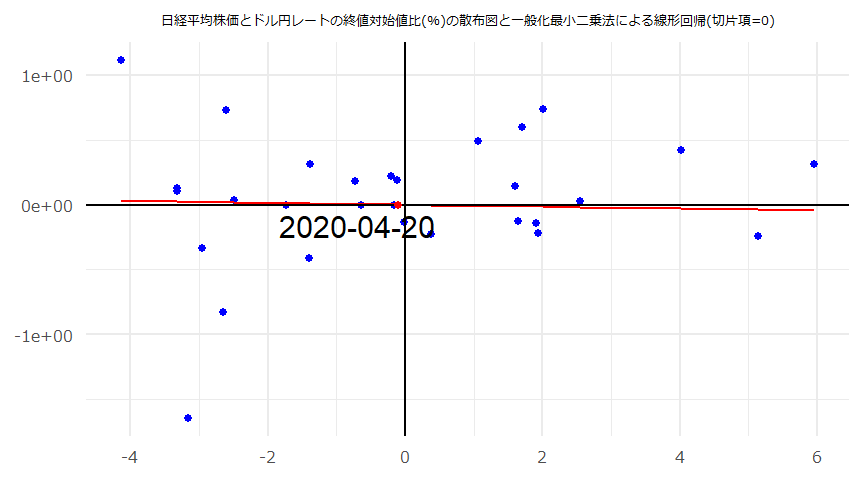
- 日経平均株価の終値対始値比(\(x\))と東京市場ドル円レートの終値対始値比(\(y\))との正規線形モデル。
- 対象期間: 2020-03-09 ~ 2020-04-20,30営業日
- 終値対始値比(\(\%\)):分母は始値、分子は終値。
- \(y=ax+b+\epsilon,\;\epsilon \sim N(0,\sigma^2)\)
- 有意水準は\(5\%\)。
- \(a=0\)および\(b=0\)が棄却されなかった場合、15時時点(大引け時点)の日経平均株価が始値比で仮に1%上昇(下落)したとすると、その2時間後(17時点)のドル円レートは9時時点のドル円レートより\((a+b)\%\)上昇(下落)することを意味する。
- Ljung-Box 検定のラグは10としている。
- 過去の解説動画:twitter
- 過去の解説動画:twilog
- https://www.boj.or.jp/statistics/market/forex/fxdaily/fxlist/index.htm/
- http://www.stat-search.boj.or.jp/ssi/cgi-bin/famecgi2?cgi=$nme_a000&lstSelection=FM08
[1] "USDJPY"
         Date   Open   High    Low  Close Center  Index CloseToOpen HighToLow Close:Diff(lag=1) Close:Ratio(lag=1)
1  2020-03-09 103.95 104.60 101.60 102.24 102.10 111.22      -1.645     2.953             -3.56             -3.365
2  2020-03-10 103.09 105.02 102.04 103.85 103.25 107.94       0.737     2.920              1.61              1.575
3  2020-03-11 105.03 105.39 104.12 105.03 105.00 109.36       0.000     1.220              1.18              1.136
4  2020-03-12 104.54 104.80 103.10 103.67 104.00 110.25      -0.832     1.649             -1.36             -1.295
5  2020-03-13 104.67 106.00 104.50 105.84 105.08 106.89       1.118     1.435              2.17              2.093
6  2020-03-16 106.49 107.56 105.73 106.60 106.90 109.31       0.103     1.731              0.76              0.718
7  2020-03-17 106.23 107.19 105.90 106.87 106.58 107.99       0.602     1.218              0.27              0.253
8  2020-03-18 107.38 107.57 106.76 107.42 107.35 108.60       0.037     0.759              0.55              0.515
9  2020-03-19 108.37 109.56 108.00 109.16 108.85 106.80       0.729     1.444              1.74              1.620
10 2020-03-23 110.40 111.24 109.67 110.24 110.18 106.48      -0.145     1.432              1.08              0.989
11 2020-03-24 110.81 111.25 110.07 110.54 110.45 105.77      -0.244     1.072              0.30              0.272
12 2020-03-25 111.12 111.49 110.76 111.47 111.13 105.69       0.315     0.659              0.93              0.841
13 2020-03-26 110.85 111.24 110.37 110.48 110.74 106.43      -0.334     0.788             -0.99             -0.888
14 2020-03-27 109.15 109.51 108.24 108.91 108.40 108.01      -0.220     1.173             -1.57             -1.421
15 2020-03-30 107.46 108.24 107.15 107.99 107.55 108.57       0.493     1.017             -0.92             -0.845
16 2020-03-31 108.08 108.80 107.82 108.42 108.70 108.67       0.315     0.909              0.43              0.398
17 2020-04-01 107.52 107.94 107.25 107.66 107.58 109.64       0.130     0.643             -0.76             -0.701
18 2020-04-02 107.29 107.57 107.12 107.29 107.48 108.84       0.000     0.420             -0.37             -0.344
19 2020-04-03 108.03 108.30 107.81 108.23 108.10 108.55       0.185     0.455              0.94              0.876
20 2020-04-06 108.72 109.38 108.43 109.18 108.95 107.65       0.423     0.876              0.95              0.878
21 2020-04-07 109.13 109.26 108.68 108.88 108.86 107.46      -0.229     0.534             -0.30             -0.275
22 2020-04-08 108.68 109.00 108.51 108.84 108.86 107.50       0.147     0.452             -0.04             -0.037
23 2020-04-09 108.94 109.06 108.84 108.94 108.96 107.40       0.000     0.202              0.10              0.092
24 2020-04-10 108.55 108.62 108.32 108.40 108.60 107.31      -0.138     0.277             -0.54             -0.496
25 2020-04-13 108.34 108.52 107.79 107.89 108.26 108.20      -0.415     0.677             -0.51             -0.470
26 2020-04-14 107.64 107.76 107.54 107.67 107.65 108.51       0.028     0.205             -0.22             -0.204
27 2020-04-15 107.12 107.38 106.93 107.36 107.17 108.77       0.224     0.421             -0.31             -0.288
28 2020-04-16 107.63 108.08 107.41 107.83 107.69 108.55       0.186     0.624              0.47              0.438
29 2020-04-17 107.94 108.08 107.64 107.80 107.93 108.65      -0.130     0.409             -0.03             -0.028
30 2020-04-20 107.70 107.95 107.50 107.70 107.86     NA       0.000     0.419             -0.10             -0.093
[1] "NIKKEI"
Date Open High Low Close CloseToOpen HighToLow Close:Diff(lag=1) Close:Ratio(lag=1)
1 2020-03-09 20343.31 20347.19 19472.26 19698.76 -3.168 4.493 -1050.99 -5.065
2 2020-03-10 19474.89 19970.35 18891.77 19867.12 2.014 5.709 168.36 0.855
3 2020-03-11 19758.26 19974.83 19392.25 19416.06 -1.732 3.004 -451.06 -2.270
4 2020-03-12 19064.51 19142.18 18339.27 18559.63 -2.648 4.378 -856.43 -4.411
5 2020-03-13 18183.47 18184.46 16690.60 17431.05 -4.138 8.950 -1128.58 -6.081
6 2020-03-16 17586.08 17785.76 16914.45 17002.04 -3.321 5.151 -429.01 -2.461
7 2020-03-17 16726.95 17557.04 16378.94 17011.53 1.701 7.193 9.49 0.056
8 2020-03-18 17154.08 17396.84 16698.46 16726.55 -2.492 4.182 -284.98 -1.675
9 2020-03-19 16995.77 17160.97 16358.19 16552.83 -2.606 4.908 -173.72 -1.039
10 2020-03-23 16570.57 17049.03 16480.95 16887.78 1.914 3.447 334.95 2.024
11 2020-03-24 17206.88 18100.39 17197.14 18092.35 5.146 5.252 1204.57 7.133
12 2020-03-25 18446.80 19564.38 18446.80 19546.63 5.962 6.058 1454.28 8.038
13 2020-03-26 19234.77 19240.29 18512.81 18664.60 -2.964 3.930 -882.03 -4.512
14 2020-03-27 19021.97 19389.43 18832.21 19389.43 1.932 2.959 724.83 3.883
15 2020-03-30 18884.07 19084.97 18578.20 19084.97 1.064 2.728 -304.46 -1.570
16 2020-03-31 19181.90 19336.19 18834.16 18917.01 -1.381 2.666 -167.96 -0.880
17 2020-04-01 18686.12 18784.25 17871.62 18065.41 -3.322 5.107 -851.60 -4.502
18 2020-04-02 17934.42 18132.04 17707.66 17818.72 -0.645 2.397 -246.69 -1.366
19 2020-04-03 17951.44 18059.15 17646.50 17820.19 -0.731 2.338 1.47 0.008
20 2020-04-06 17857.99 18672.26 17802.62 18576.30 4.022 4.885 756.11 4.243
21 2020-04-07 18878.86 19162.52 18553.14 18950.18 0.378 3.285 373.88 2.013
22 2020-04-08 19047.76 19454.34 18730.80 19353.24 1.604 3.863 403.06 2.127
23 2020-04-09 19376.00 19406.96 19158.55 19345.77 -0.156 1.297 -7.47 -0.039
24 2020-04-10 19500.07 19500.07 19235.96 19498.50 -0.008 1.373 152.73 0.789
25 2020-04-13 19312.04 19355.04 19014.32 19043.40 -1.391 1.792 -455.10 -2.334
26 2020-04-14 19150.30 19705.99 19093.12 19638.81 2.551 3.210 595.41 3.127
27 2020-04-15 19589.25 19660.68 19465.95 19550.09 -0.200 1.000 -88.72 -0.452
28 2020-04-16 19311.30 19362.17 19154.41 19290.20 -0.109 1.085 -259.89 -1.329
29 2020-04-17 19575.85 19922.07 19554.70 19897.26 1.642 1.879 607.06 3.147
30 2020-04-20 19689.85 19784.38 19611.79 19669.12 -0.105 0.880 -228.14 -1.147単位根検定・共和分検定
- CADFtest {CADFtest}
- ca.po {urca}
$USDJPY_CloseToOpen

    ADF test

data:  x
ADF(2) = -2.7782, p-value = 0.2165
alternative hypothesis: true delta is less than 0
sample estimates:
    delta
-1.137738


$NIKKEI_CloseToOpen

    ADF test

data:  x
ADF(0) = -4.0781, p-value = 0.01784
alternative hypothesis: true delta is less than 0
sample estimates:
     delta
-0.8222206
########################################
# Phillips and Ouliaris Unit Root Test #
########################################

Test of type Pu
detrending of series none


Call:
lm(formula = z[, 1] ~ z[, -1] - 1)

Residuals:
     Min       1Q   Median       3Q      Max
-1.55209 -0.19539  0.07538  0.22926  1.23936

Coefficients:
        Estimate Std. Error t value Pr(>|t|)
z[, -1]  0.02933    0.03604   0.814    0.422

Residual standard error: 0.4987 on 29 degrees of freedom
Multiple R-squared:  0.02233,   Adjusted R-squared:  -0.01138
F-statistic: 0.6624 on 1 and 29 DF,  p-value: 0.4224


Value of test-statistic is: 15.0844

Critical values of Pu are:
                  10pct    5pct    1pct
critical values 20.3933 25.9711 38.3413
最小二乗法
- lm {stats}
- dwtest {lmtest}
- ks.test {stats}
- confint {stats}
- Box.test {stats}
- 切片項\(\neq0\)
MODEL INFO:
Observations: 30
Dependent Variable: USDJPY_CloseToOpen
Type: OLS linear regression

MODEL FIT:
F(1,28) = 0.66, p = 0.42
R2 = 0.02
Adj. R2 = -0.01

Standard errors: OLS
---------------------------------------------------------------
                           Est.    2.5%   97.5%   t val.      p
------------------------ ------ ------- ------- -------- ------
(Intercept)                0.05   -0.14    0.24     0.53   0.60
NIKKEI_CloseToOpen         0.03   -0.05    0.10     0.81   0.42
---------------------------------------------------------------
    Durbin-Watson test

data:  OLS_Model
DW = 2.0817, p-value = 0.5747
alternative hypothesis: true autocorrelation is greater than 0
    One-sample Kolmogorov-Smirnov test

data:  ResidualsOLS
D = 0.12449, p-value = 0.6951
alternative hypothesis: two-sided
2.5 % 97.5 %
(Intercept) -0.13970134 0.2380463
NIKKEI_CloseToOpen -0.04512226 0.1043895
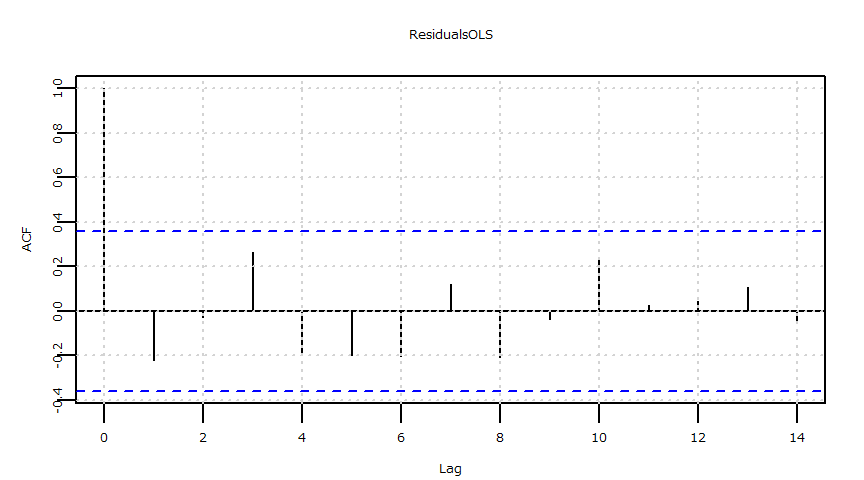
    Box-Ljung test

data:  ResidualsOLS
X-squared = 13.767, df = 10, p-value = 0.1839- 切片項\(=0\)
MODEL INFO:
Observations: 30
Dependent Variable: USDJPY_CloseToOpen
Type: OLS linear regression

MODEL FIT:
F(1,29) = 0.66, p = 0.42
R2 = 0.02
Adj. R2 = -0.01

Standard errors: OLS
---------------------------------------------------------------
                           Est.    2.5%   97.5%   t val.      p
------------------------ ------ ------- ------- -------- ------
NIKKEI_CloseToOpen         0.03   -0.04    0.10     0.81   0.42
---------------------------------------------------------------
    Durbin-Watson test

data:  OLS_Model_no_intercept
DW = 2.062, p-value = 0.6289
alternative hypothesis: true autocorrelation is greater than 0
    One-sample Kolmogorov-Smirnov test

data:  ResidualsOLS_no_intercept
D = 0.15523, p-value = 0.4222
alternative hypothesis: two-sided
2.5 % 97.5 %
NIKKEI_CloseToOpen -0.0443754 0.103033
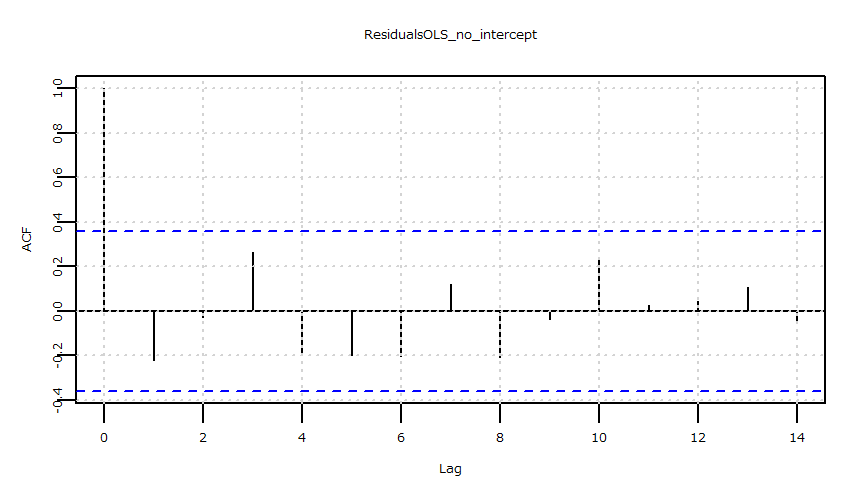
Box-Ljung test
data: ResidualsOLS_no_intercept
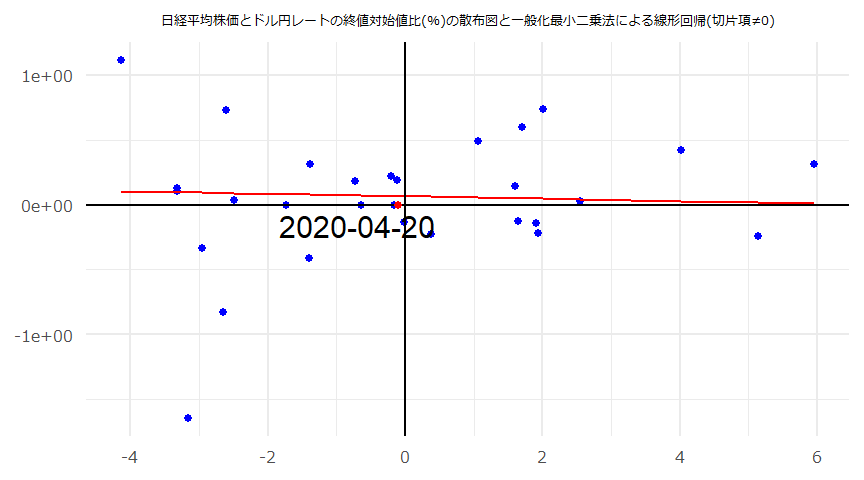
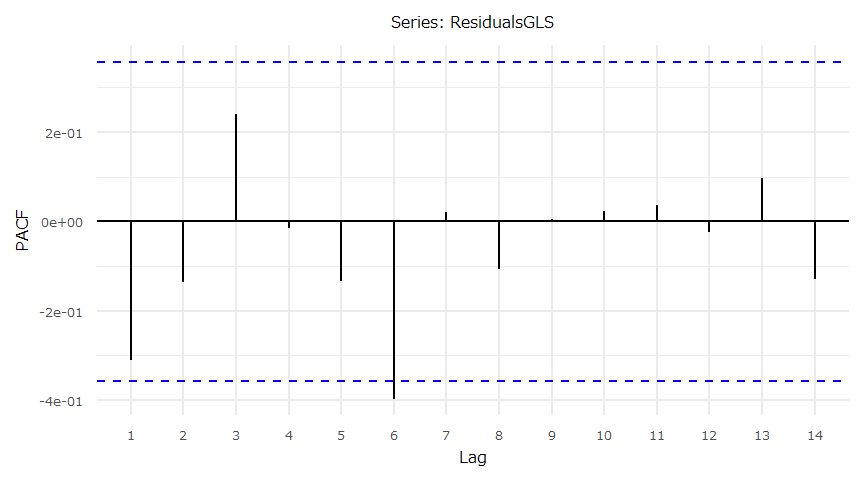
X-squared = 13.759, df = 10, p-value = 0.1843一般化最小二乗法
- gls {nlme}
- corARMA {nlme}
- ks.test {stats}
- confint {stats}
- Box.test {stats}
- 残差の系列相関の有無に拘わらず一般化最小二乗法による回帰係数を求めています。
- 最小二乗法の残差に系列相関が見られない場合、ここではAR(\(p=0,q=0\))の結果(AIC最小)が表示されます。
- http://user.keio.ac.jp/~nagakura/zemi/GLS.pdf
- http://tokyox.matrix.jp/wiki/index.php?%E4%B8%80%E8%88%AC%E5%8C%96%E6%9C%80%E5%B0%8F%E4%BA%8C%E4%B9%97%E6%B3%95
- 切片項\(\neq0\)
Generalized least squares fit by REML
  Model: USDJPY_CloseToOpen ~ NIKKEI_CloseToOpen
  Data: USDJPY_NIKKEI
       AIC      BIC    logLik
  55.29764 60.62645 -23.64882

Correlation Structure: AR(1)
 Formula: ~1
 Parameter estimate(s):
       Phi
-0.4451758

Coefficients:
                         Value  Std.Error    t-value p-value
(Intercept)         0.06619396 0.06025475  1.0985683  0.2813
NIKKEI_CloseToOpen -0.00946658 0.02958071 -0.3200255  0.7513

 Correlation:
                   (Intr)
NIKKEI_CloseToOpen 0.003

Standardized residuals:
        Min          Q1         Med          Q3         Max
-3.30307059 -0.38219562 -0.06338854  0.40933578  1.92099120

Residual standard error: 0.5271411
Degrees of freedom: 30 total; 28 residual
    One-sample Kolmogorov-Smirnov test

data:  ResidualsGLS
D = 0.14896, p-value = 0.4736
alternative hypothesis: two-sided
2.5 % 97.5 %
(Intercept) -0.05190318 0.18429111
NIKKEI_CloseToOpen -0.06744372 0.04851055
    Box-Ljung test

data:  ResidualsGLS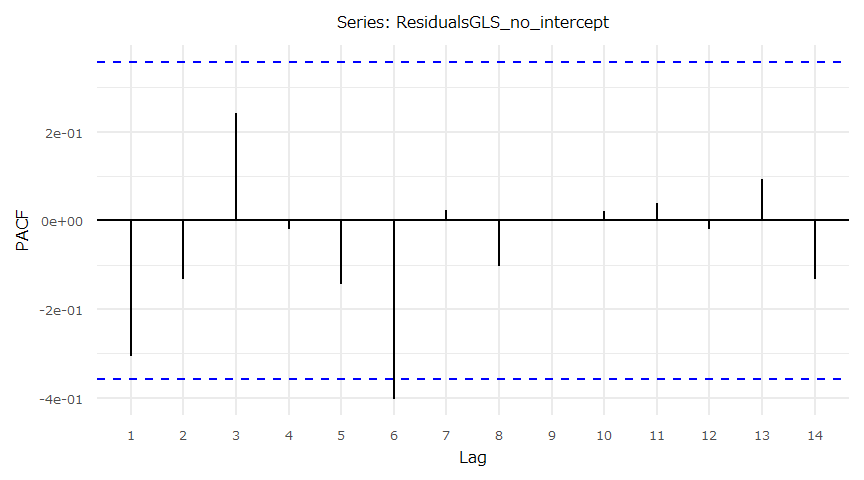
X-squared = 12.688, df = 10, p-value = 0.2417- 切片項\(=0\)
Generalized least squares fit by REML
  Model: USDJPY_CloseToOpen ~ NIKKEI_CloseToOpen - 1
  Data: USDJPY_NIKKEI
       AIC      BIC    logLik
  50.69885 54.80074 -22.34943

Correlation Structure: AR(1)
 Formula: ~1
 Parameter estimate(s):
       Phi
-0.4085827

Coefficients:
                          Value  Std.Error    t-value p-value
NIKKEI_CloseToOpen -0.007212041 0.03018111 -0.2389588  0.8128

Standardized residuals:
        Min          Q1         Med          Q3         Max
-3.21104944 -0.26249512  0.06298073  0.54758305  2.09499013

Residual standard error: 0.5194089
Degrees of freedom: 30 total; 29 residual
    One-sample Kolmogorov-Smirnov test

data:  ResidualsGLS_no_intercept
D = 0.19376, p-value = 0.1841
alternative hypothesis: two-sided
2.5 % 97.5 %
NIKKEI_CloseToOpen -0.06636593 0.05194185
Box-Ljung test
data: ResidualsGLS_no_intercept
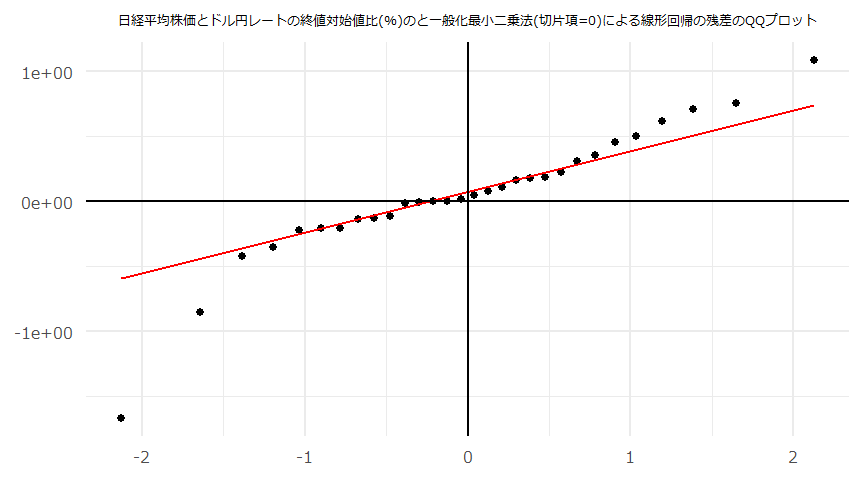
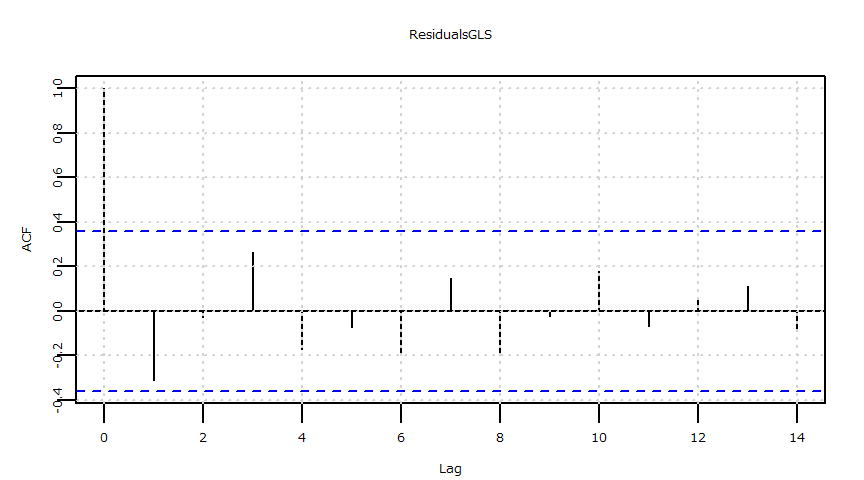
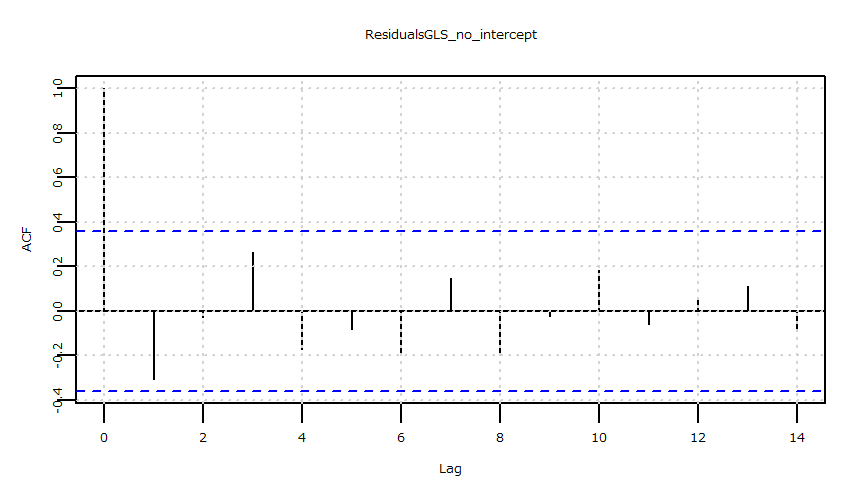
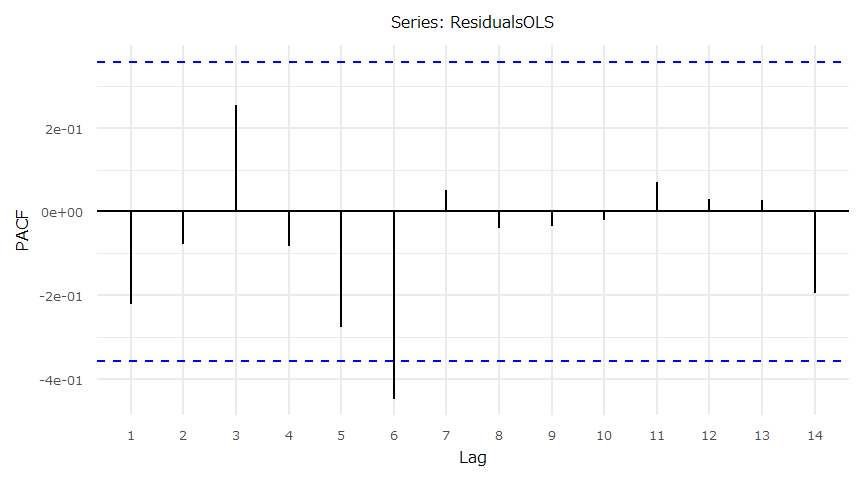
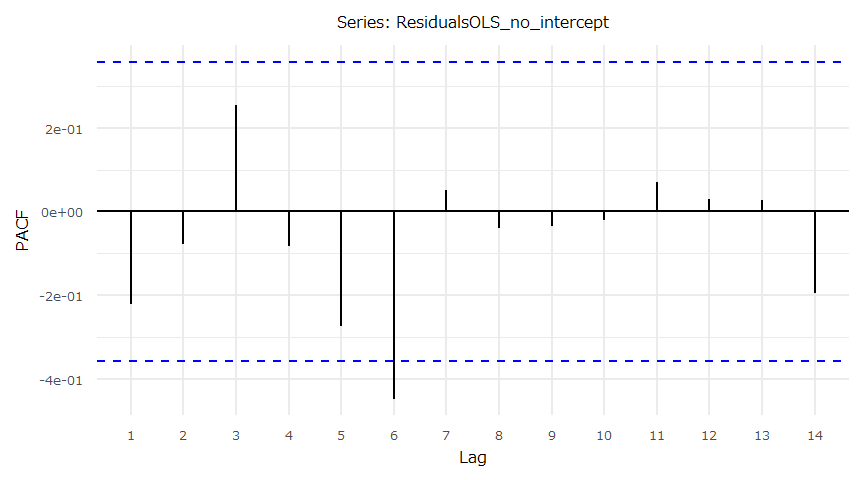
X-squared = 12.755, df = 10, p-value = 0.2377散布図・QQプロット・残差の時系列推移
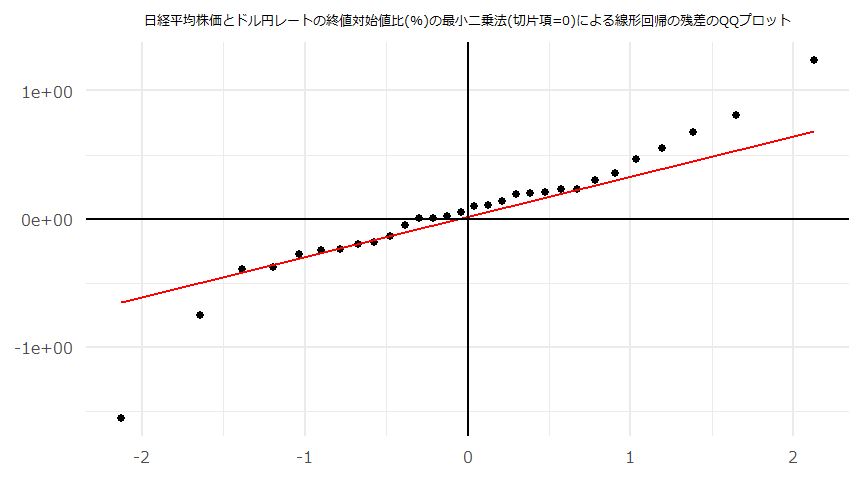
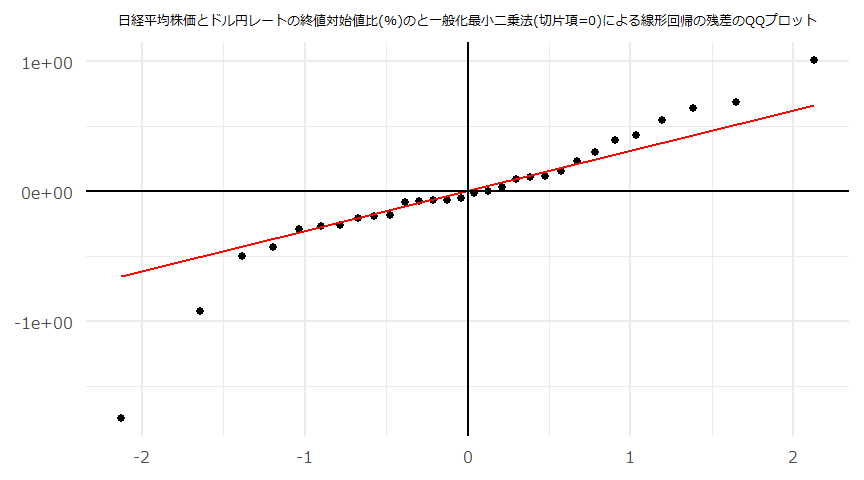
- (注意)線形回帰の傾き(\(a\))、切片(\(b\))それぞれの検定統計量、p値に関わらず\(y=ax+b\)とした回帰直線やその残差を散布図、QQプロット等にプロットしています。
- 散布図とQQプロット
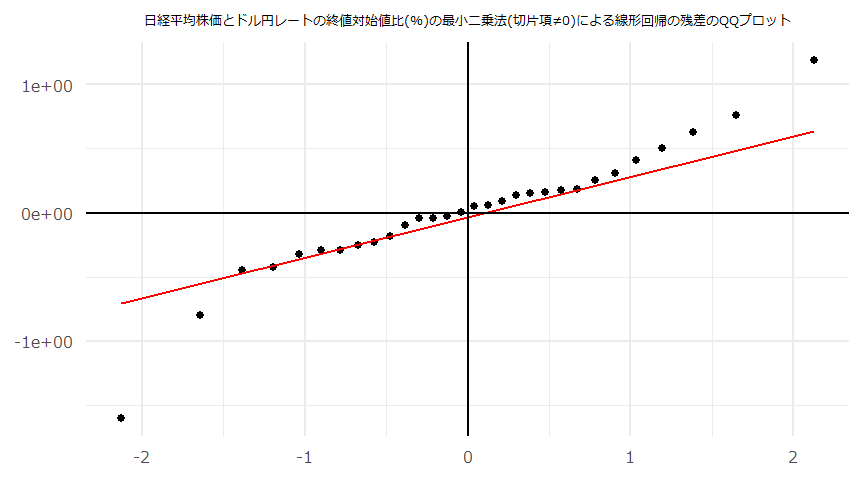
- 残差の自己相関(ACF)
- 残差の自己相関(PACF)
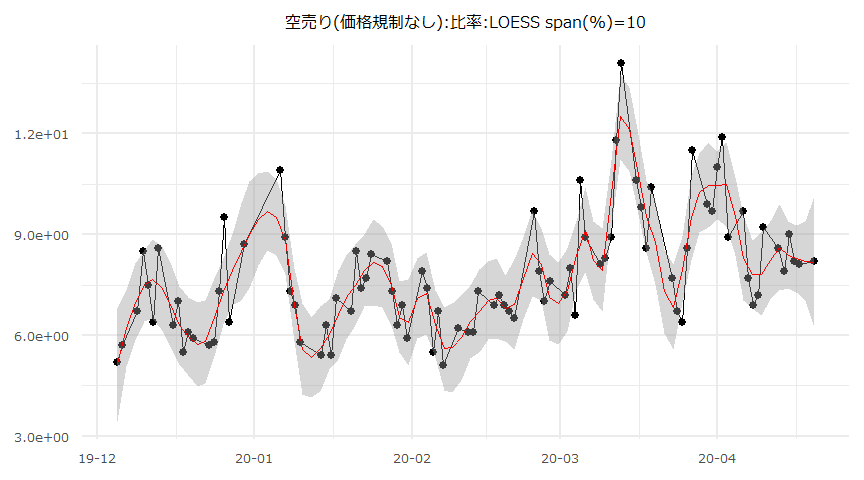
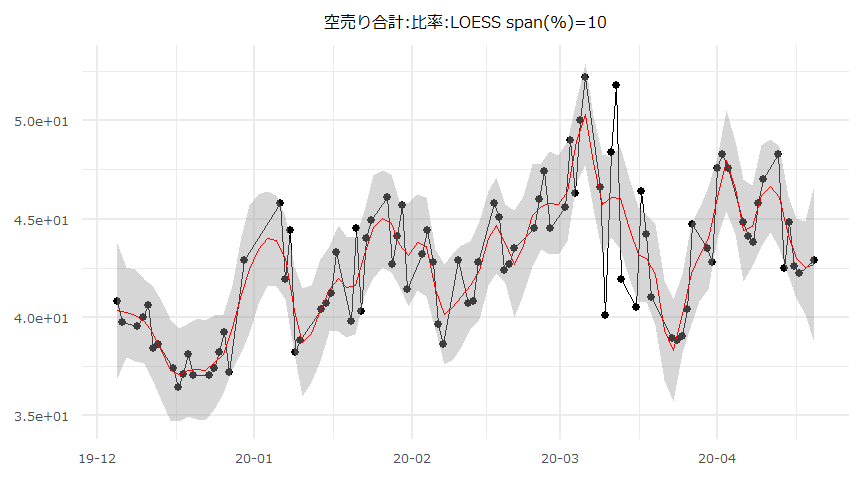
空売り比率と日経平均株価
- Source:日本取引所グループ、日本経済新聞社
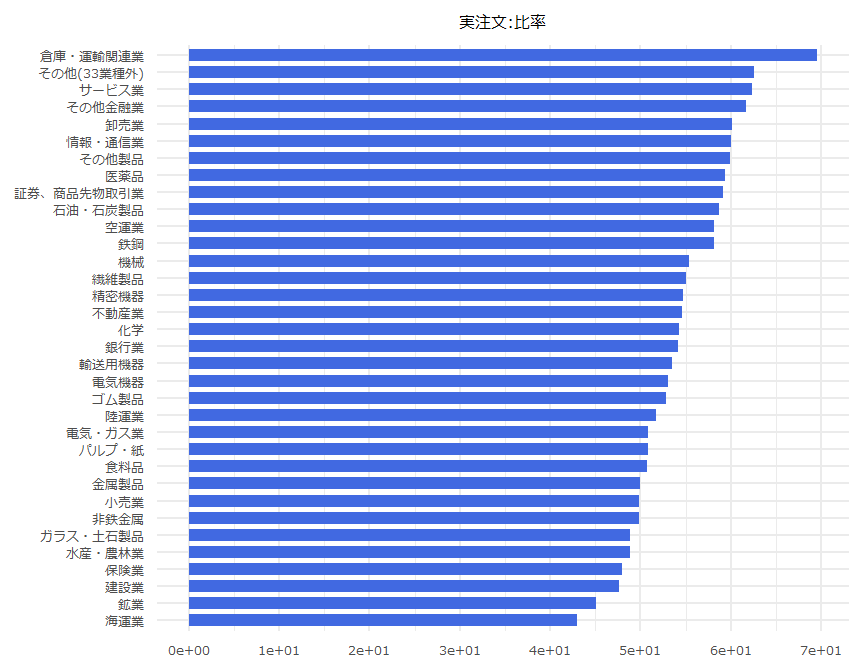
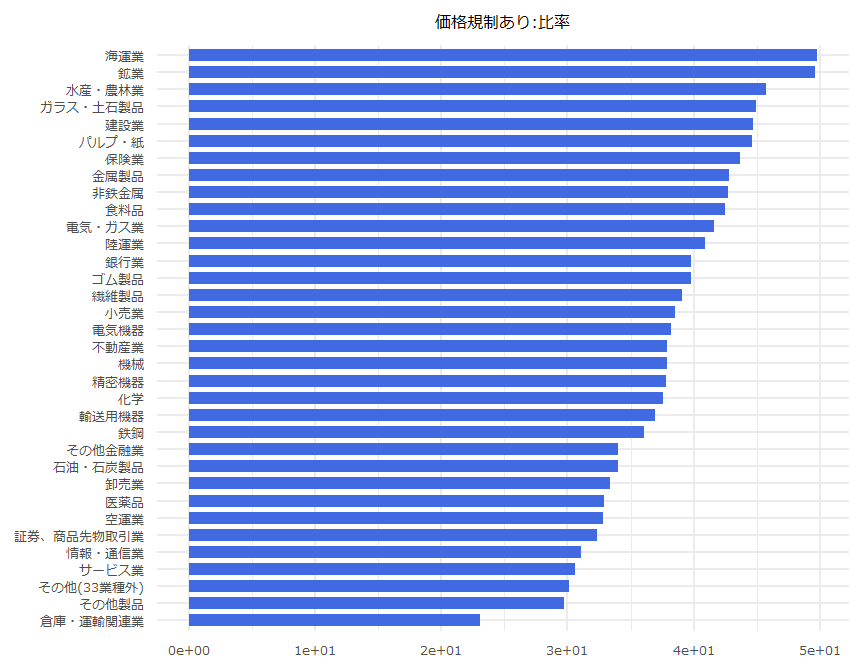
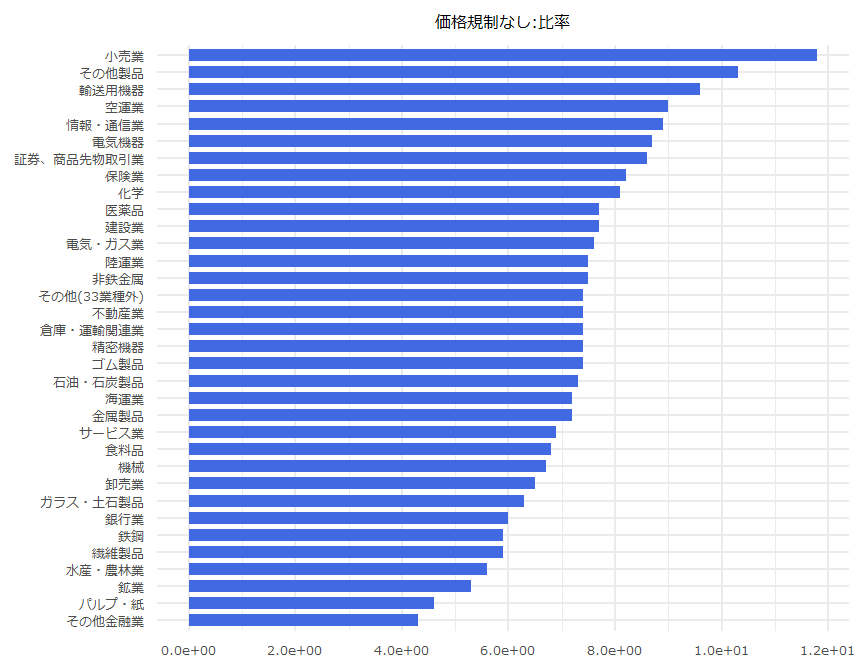
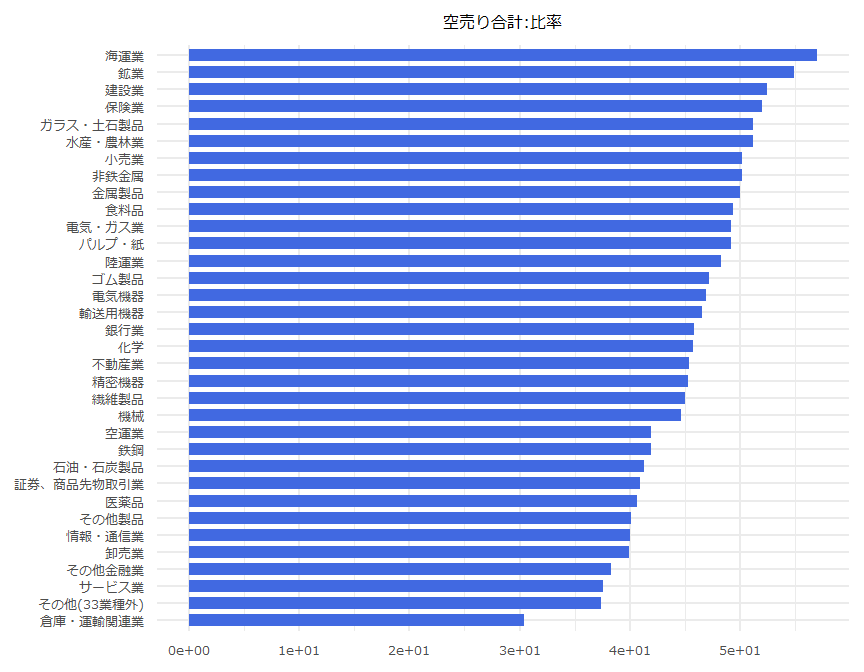
業種別空売り集計
- 2020年04月20日
- 「空売り合計:比率」は100から「実注文:比率」を減じた数値としています。
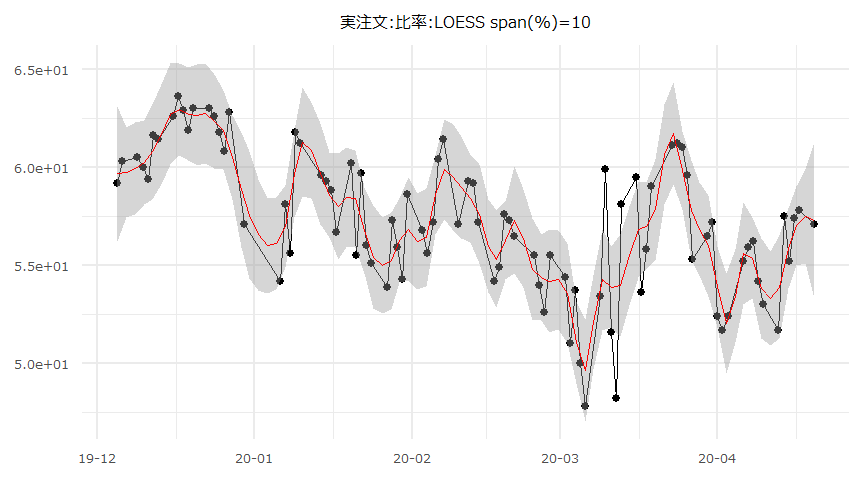
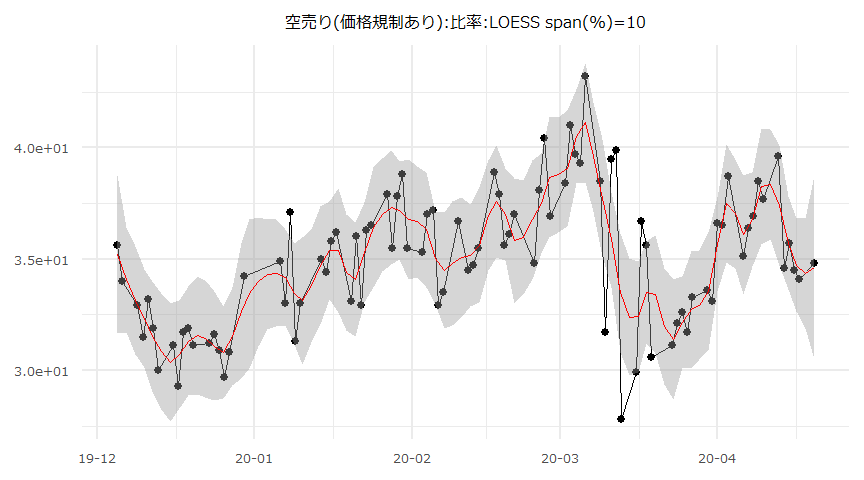
空売り比率の時系列推移
- 2019-12-05 ~ 2020-04-20
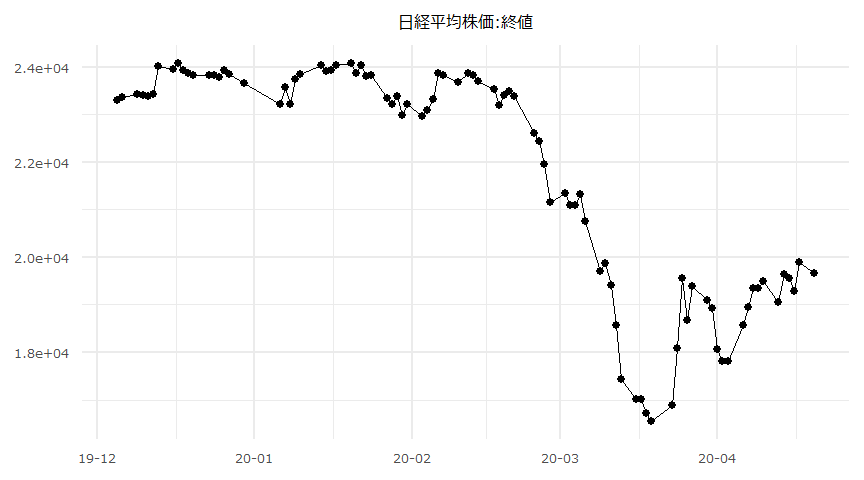
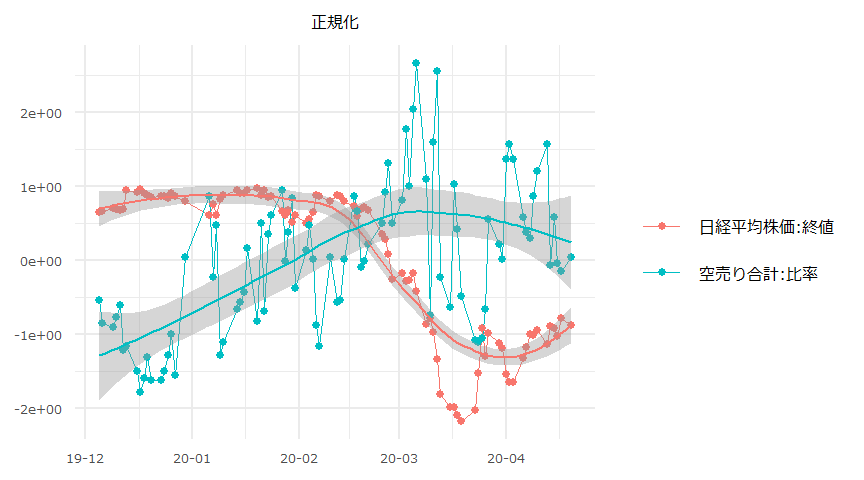
日経平均株価と空売り比率
時系列推移
- 対象期間:2019-12-05 ~ 2020-04-20
単位根検定/共和分検定
- CADFtest {CADFtest}
- ca.po {urca}
- 各系列の“_change“は前営業日との差。
- 対象期間: 2019-12-05 ~ 2020-04-20,90days
### 単位根検定 ###

$NIKKEI225.close

    ADF test

data:  x
ADF(2) = -2.128, p-value = 0.5229
alternative hypothesis: true delta is less than 0
sample estimates:
      delta
-0.07556282


$ShortSalerRatio

    ADF test

data:  x
ADF(2) = -2.881, p-value = 0.1738
alternative hypothesis: true delta is less than 0
sample estimates:
    delta
-0.345017


$NIKKEI225.close_change

    ADF test

data:  x
ADF(1) = -5.1364, p-value = 0.0003089
alternative hypothesis: true delta is less than 0
sample estimates:
     delta
-0.7399899


$ShortSalerRatio_change

    ADF test

data:  x
ADF(1) = -11.428, p-value = 0.0000000000001019
alternative hypothesis: true delta is less than 0
sample estimates:
    delta
-1.757469
### 共和分検定 ###
########################################
# Phillips and Ouliaris Unit Root Test #
########################################
Test of type Pu
detrending of series none
Call:
lm(formula = z[, 1] ~ z[, -1] - 1)
Residuals:
Min 1Q Median 3Q Max
-7542.9 -2717.1 771.1 3328.9 5723.8
Coefficients:
Estimate Std. Error t value Pr(>|t|)
z[, -1] 503.910 8.665 58.15 <0.0000000000000002 ***
---
Signif. codes: 0 '***' 0.001 '**' 0.01 '*' 0.05 '.' 0.1 ' ' 1
Residual standard error: 3525 on 89 degrees of freedom
Multiple R-squared: 0.9744, Adjusted R-squared: 0.9741
F-statistic: 3382 on 1 and 89 DF, p-value: < 0.00000000000000022
Value of test-statistic is: 1.6365
Critical values of Pu are:
10pct 5pct 1pct
critical values 20.3933 25.9711 38.3413最小二乗法
- lm {stats}
- dwtest {lmtest}
- ks.test {stats}
- confint {stats}
- Box.test {stats}
- Ljung-Box 検定のラグは15としている。
- 対象期間: 2019-12-05 ~ 2020-04-20,90days
- 切片項\(\neq0\)
Call:
lm(formula = NIKKEI225.close_change ~ ShortSalerRatio_change,
    data = datadf)

Residuals:
     Min       1Q   Median       3Q      Max
-1282.12  -171.85     6.78   180.59  1496.80

Coefficients:
                       Estimate Std. Error t value Pr(>|t|)
(Intercept)              -38.64      44.57  -0.867    0.388
ShortSalerRatio_change   -19.41      15.27  -1.271    0.207

Residual standard error: 422.8 on 88 degrees of freedom
Multiple R-squared:  0.01803,   Adjusted R-squared:  0.006866
F-statistic: 1.615 on 1 and 88 DF,  p-value: 0.2071
    Durbin-Watson test

data:  OLS_Model
DW = 1.7306, p-value = 0.1041
alternative hypothesis: true autocorrelation is greater than 0
    One-sample Kolmogorov-Smirnov test

data:  ResidualsOLS
D = 0.11392, p-value = 0.179
alternative hypothesis: two-sided
2.5 % 97.5 %
(Intercept) -127.20853 49.92503
ShortSalerRatio_change -49.76667 10.94125
    Box-Ljung test

data:  ResidualsOLS
X-squared = 19.513, df = 15, p-value = 0.1914- 切片項\(=0\)
Call:
lm(formula = NIKKEI225.close_change ~ ShortSalerRatio_change -
    1, data = datadf)

Residuals:
     Min       1Q   Median       3Q      Max
-1320.47  -210.52   -31.87   142.04  1458.16

Coefficients:
                       Estimate Std. Error t value Pr(>|t|)
ShortSalerRatio_change   -19.38      15.25  -1.271    0.207

Residual standard error: 422.2 on 89 degrees of freedom
Multiple R-squared:  0.01782,   Adjusted R-squared:  0.006785
F-statistic: 1.615 on 1 and 89 DF,  p-value: 0.2071
    Durbin-Watson test

data:  OLS_Model_no_intercept
DW = 1.716, p-value = 0.1108
alternative hypothesis: true autocorrelation is greater than 0
    One-sample Kolmogorov-Smirnov test

data:  ResidualsOLS_no_intercept
D = 0.14573, p-value = 0.03933
alternative hypothesis: two-sided
2.5 % 97.5 %
ShortSalerRatio_change -49.68923 10.92432
    Box-Ljung test

data:  ResidualsOLS_no_intercept
X-squared = 19.515, df = 15, p-value = 0.1914
一般化最小二乗法
- gls {nlme}
- corARMA {nlme}
- ks.test {stats}
- confint {stats}
- Box.test {stats}
- 残差の系列相関の有無に拘わらず一般化最小二乗法による回帰係数を求めています。
- 最小二乗法の残差に系列相関が見られない場合、ここではAR(p=0,q=0)の結果(AIC最小)が表示されます。
- http://user.keio.ac.jp/~nagakura/zemi/GLS.pdf
- http://tokyox.matrix.jp/wiki/index.php?%E4%B8%80%E8%88%AC%E5%8C%96%E6%9C%80%E5%B0%8F%E4%BA%8C%E4%B9%97%E6%B3%95
- Ljung-Box 検定のラグは15としている。
- 切片項\(\neq0\)
Generalized least squares fit by REML
  Model: NIKKEI225.close_change ~ ShortSalerRatio_change
  Data: datadf
       AIC      BIC    logLik
  1331.127 1338.559 -662.5633

Coefficients:
                           Value Std.Error   t-value p-value
(Intercept)            -38.64175  44.56661 -0.867056  0.3883
ShortSalerRatio_change -19.41271  15.27405 -1.270961  0.2071

 Correlation:
                       (Intr)
ShortSalerRatio_change 0.002

Standardized residuals:
        Min          Q1         Med          Q3         Max
-3.03249656 -0.40645203  0.01604199  0.42714459  3.54026088

Residual standard error: 422.7949
Degrees of freedom: 90 total; 88 residual
    One-sample Kolmogorov-Smirnov test

data:  ResidualsGLS
D = 0.11392, p-value = 0.179
alternative hypothesis: two-sided
2.5 % 97.5 %
(Intercept) -125.9907 48.70721
ShortSalerRatio_change -49.3493 10.52387
    Box-Ljung test

data:  ResidualsGLS
X-squared = 19.513, df = 15, p-value = 0.1914- 切片項\(=0\)
Generalized least squares fit by REML
  Model: NIKKEI225.close_change ~ ShortSalerRatio_change - 1
  Data: datadf
      AIC      BIC    logLik
  1339.31 1344.287 -667.6549

Coefficients:
                           Value Std.Error   t-value p-value
ShortSalerRatio_change -19.38246  15.25269 -1.270756  0.2071

Standardized residuals:
        Min          Q1         Med          Q3         Max
-3.12754828 -0.49861356 -0.07549153  0.33642742  3.45366996

Residual standard error: 422.2049
Degrees of freedom: 90 total; 89 residual
    One-sample Kolmogorov-Smirnov test

data:  ResidualsGLS_no_intercept
D = 0.14573, p-value = 0.03933
alternative hypothesis: two-sided
2.5 % 97.5 %
ShortSalerRatio_change -49.27719 10.51228
Box-Ljung test
data: ResidualsGLS_no_intercept
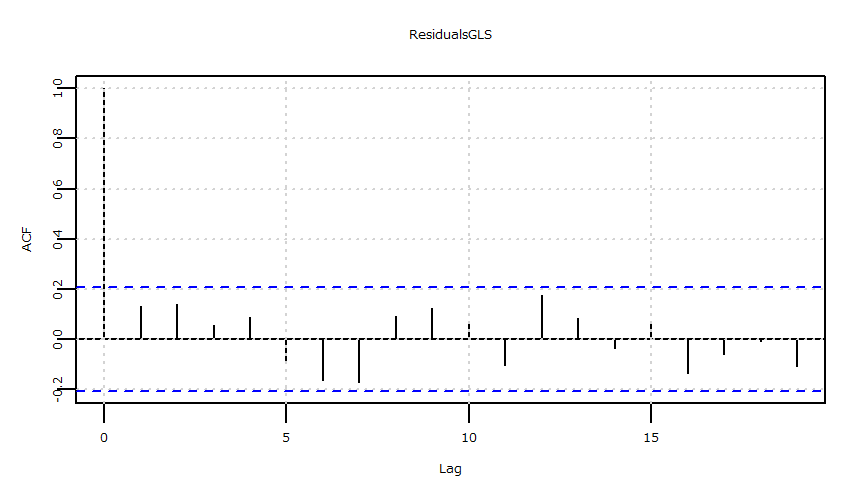
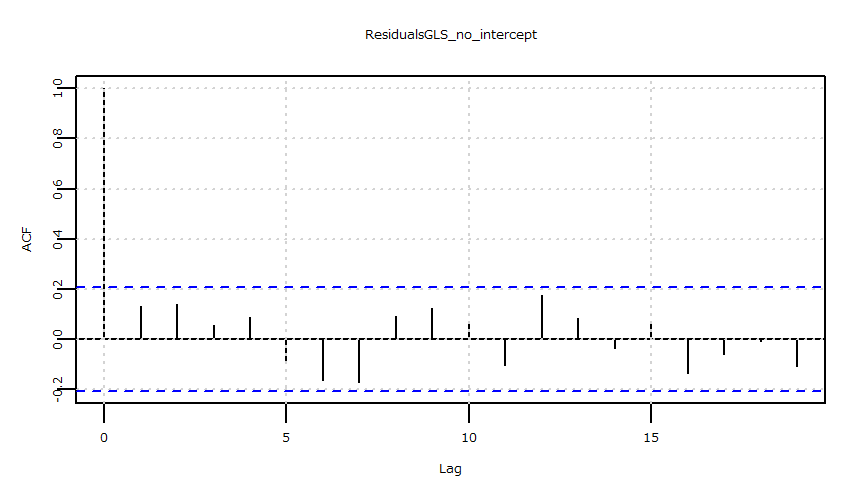
X-squared = 19.515, df = 15, p-value = 0.1914残差
- 時系列推移
- 自己相関
- 時系列推移

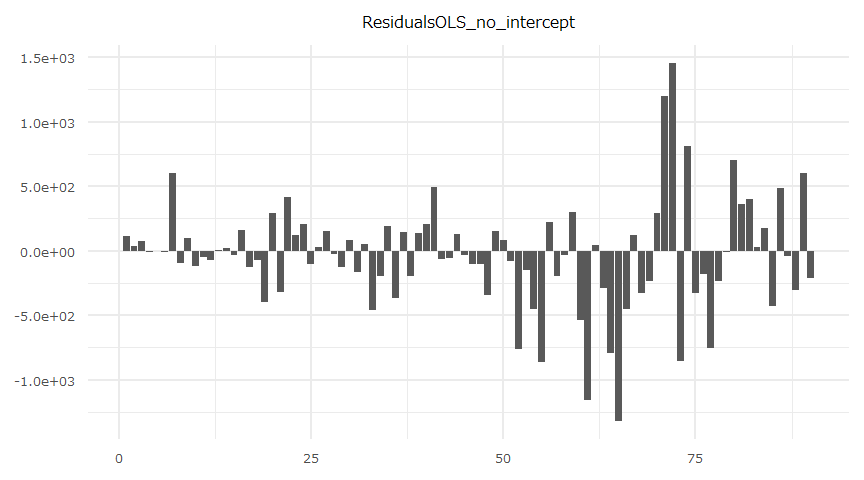
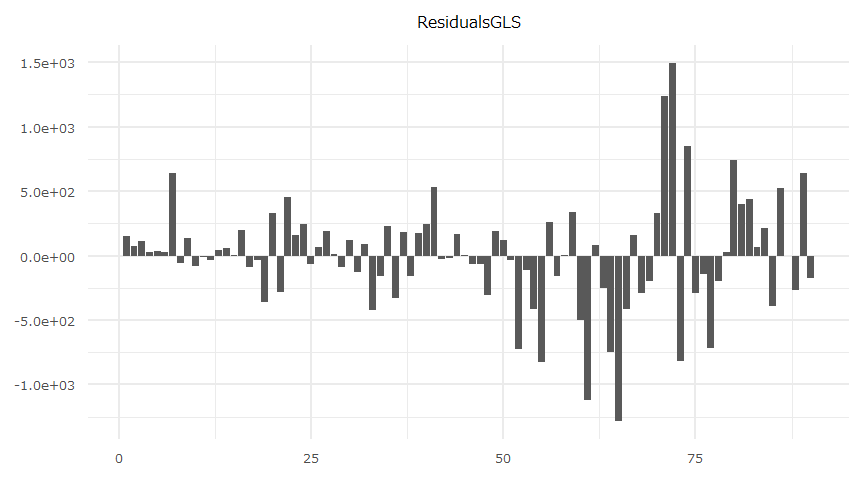

- 自己相関


Summary