日経平均株価と東京市場ドル円レート
Updated time:2020-01-15 09:20:34
- Source:日本銀行,日本経済新聞社
[1] "USDJPY"
         Date   Open   High    Low  Close Center  Index CloseToOpen HighToLow     MA25 DeviationRate Close:Diff(lag=1) Close:Ratio(lag=1)
56 2019-12-18 109.53 109.57 109.42 109.44 109.44 103.47      -0.082     0.137 108.9536          0.45             -0.16             -0.146
57 2019-12-19 109.55 109.72 109.55 109.58 109.58 103.62       0.027     0.155 108.9868          0.54              0.14              0.128
58 2019-12-20 109.39 109.40 109.26 109.37 109.39 103.61      -0.018     0.128 109.0192          0.32             -0.21             -0.192
59 2019-12-23 109.50 109.54 109.37 109.40 109.42 103.69      -0.091     0.155 109.0384          0.33              0.03              0.027
60 2019-12-24 109.40 109.45 109.37 109.40 109.40 103.65       0.000     0.073 109.0676          0.30              0.00              0.000
61 2019-12-25 109.38 109.44 109.31 109.35 109.38 103.57      -0.027     0.119 109.1040          0.23             -0.05             -0.046
62 2019-12-26 109.38 109.57 109.37 109.56 109.55 103.32       0.165     0.183 109.1432          0.38              0.21              0.192
63 2019-12-27 109.53 109.59 109.43 109.51 109.49 103.32      -0.018     0.146 109.1792          0.30             -0.05             -0.046
64 2019-12-30 109.44 109.46 109.07 109.15 109.12 103.71      -0.265     0.358 109.1916         -0.04             -0.36             -0.329
65 2020-01-06 107.98 108.17 107.77 108.11 108.05 104.24       0.120     0.371 109.1576         -0.96             -1.04             -0.953
66 2020-01-07 108.42 108.51 108.28 108.33 108.44 104.15      -0.083     0.212 109.1232         -0.73              0.22              0.203
67 2020-01-08 108.01 108.50 107.65 108.42 107.82 103.49       0.380     0.790 109.0832         -0.61              0.09              0.083
68 2020-01-09 109.04 109.35 109.02 109.35 109.22 103.02       0.284     0.303 109.0772          0.25              0.93              0.858
69 2020-01-10 109.50 109.60 109.46 109.57 109.54 102.95       0.064     0.128 109.0760          0.45              0.22              0.201
70 2020-01-14 110.02 110.21 109.92 109.99 110.08     NA      -0.027     0.264 109.1116          0.81              0.42              0.383
[1] "NIKKEI"
Date Open High Low Close CloseToOpen HighToLow MA25 DeviationRate Close:Diff(lag=1) Close:Ratio(lag=1)
56 2019-12-18 24023.27 24046.09 23919.36 23934.43 -0.370 0.530 23423.75 2.18 -131.69 -0.547
57 2019-12-19 23911.46 23945.53 23835.29 23864.85 -0.195 0.463 23452.69 1.76 -69.58 -0.291
58 2019-12-20 23893.45 23908.77 23746.63 23816.63 -0.322 0.683 23473.22 1.46 -48.22 -0.202
59 2019-12-23 23921.29 23923.09 23810.82 23821.11 -0.419 0.472 23489.39 1.41 4.48 0.019
60 2019-12-24 23839.18 23853.56 23796.35 23830.58 -0.036 0.240 23510.91 1.36 9.47 0.040
61 2019-12-25 23813.59 23824.85 23782.87 23782.87 -0.129 0.177 23536.28 1.05 -47.71 -0.200
62 2019-12-26 23787.70 23931.51 23775.40 23924.92 0.577 0.657 23571.74 1.50 142.05 0.597
63 2019-12-27 23953.75 23967.18 23837.72 23837.72 -0.484 0.543 23600.73 1.00 -87.20 -0.364
64 2019-12-30 23770.93 23782.49 23656.62 23656.62 -0.481 0.532 23615.28 0.18 -181.10 -0.760
65 2020-01-06 23319.76 23365.36 23148.53 23204.86 -0.493 0.937 23608.54 -1.71 -451.76 -1.910
66 2020-01-07 23320.12 23577.44 23299.92 23575.72 1.096 1.191 23614.06 -0.16 370.86 1.598
67 2020-01-08 23217.49 23303.21 22951.18 23204.76 -0.055 1.534 23605.89 -1.70 -370.96 -1.573
68 2020-01-09 23530.29 23767.09 23506.15 23739.87 0.891 1.110 23623.72 0.49 535.11 2.306
69 2020-01-10 23813.28 23903.29 23761.08 23850.57 0.157 0.598 23636.57 0.91 110.70 0.466
70 2020-01-14 23969.04 24059.86 23951.66 24025.17 0.234 0.452 23662.38 1.53 174.60 0.732単位根検定・共和分検定
- CADFtest {CADFtest}
- ca.po {urca}
$USDJPY_CloseToOpen

    ADF test

data:  x
ADF(0) = -7.9285, p-value = 0.00000004952
alternative hypothesis: true delta is less than 0
sample estimates:
    delta
-1.067027


$NIKKEI_CloseToOpen

    ADF test

data:  x
ADF(1) = -6.4913, p-value = 0.000005539
alternative hypothesis: true delta is less than 0
sample estimates:
   delta
-1.26852
########################################
# Phillips and Ouliaris Unit Root Test #
########################################

Test of type Pu
detrending of series none


Call:
lm(formula = z[, 1] ~ z[, -1] - 1)

Residuals:
     Min       1Q   Median       3Q      Max
-0.21507 -0.03567  0.01568  0.07360  0.38571

Coefficients:
        Estimate Std. Error t value Pr(>|t|)
z[, -1]  0.10380    0.03231   3.213  0.00213 **
---
Signif. codes:  0 '***' 0.001 '**' 0.01 '*' 0.05 '.' 0.1 ' ' 1

Residual standard error: 0.1066 on 59 degrees of freedom
Multiple R-squared:  0.1489,    Adjusted R-squared:  0.1345
F-statistic: 10.32 on 1 and 59 DF,  p-value: 0.002131


Value of test-statistic is: 68.3317

Critical values of Pu are:
                  10pct    5pct    1pct
critical values 20.3933 25.9711 38.3413
最小二乗法
- lm {stats}
- dwtest {lmtest}
- ks.test {stats}
- confint {stats}
- Box.test {stats}
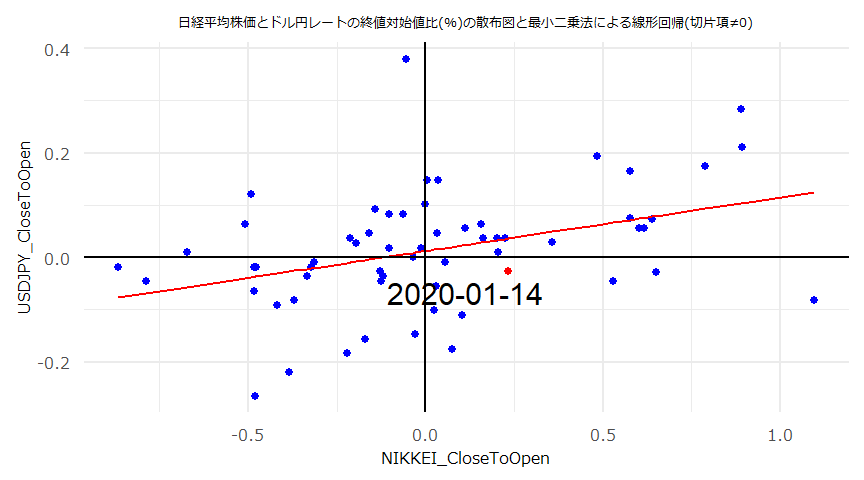
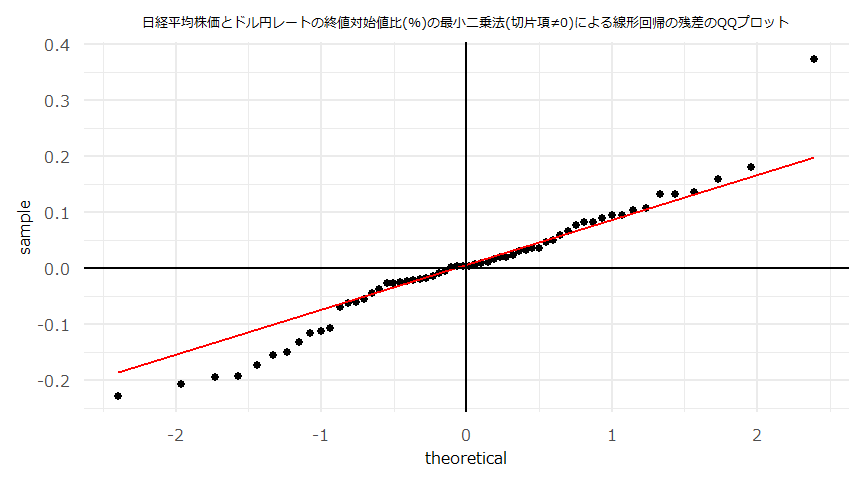
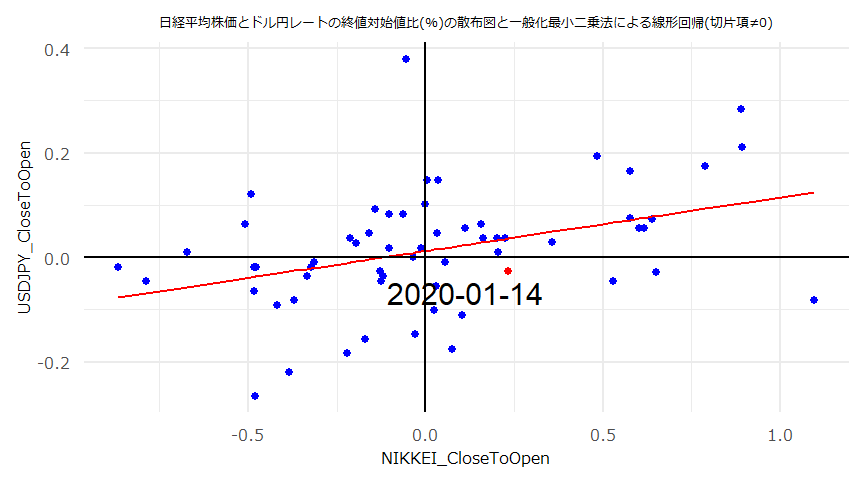
- 切片項\(\neq0\)
MODEL INFO:
Observations: 60
Dependent Variable: USDJPY_CloseToOpen
Type: OLS linear regression

MODEL FIT:
F(1,58) = 10.03, p = 0.00
R2 = 0.15
Adj. R2 = 0.13

Standard errors: OLS
---------------------------------------------------------------
                           Est.    2.5%   97.5%   t val.      p
------------------------ ------ ------- ------- -------- ------
(Intercept)                0.01   -0.02    0.04     0.90   0.37
NIKKEI_CloseToOpen         0.10    0.04    0.17     3.17   0.00
---------------------------------------------------------------
    Durbin-Watson test

data:  OLS_Model
DW = 2.2899, p-value = 0.8723
alternative hypothesis: true autocorrelation is greater than 0
    One-sample Kolmogorov-Smirnov test

data:  ResidualsOLS
D = 0.11564, p-value = 0.3702
alternative hypothesis: two-sided
2.5 % 97.5 %
(Intercept) -0.01525922 0.03996375
NIKKEI_CloseToOpen 0.03774370 0.16741850
Box-Ljung test
data: ResidualsOLS
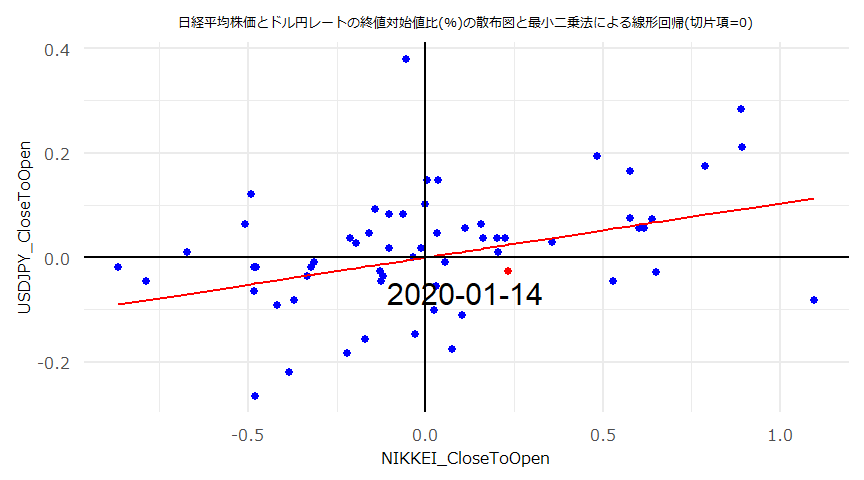
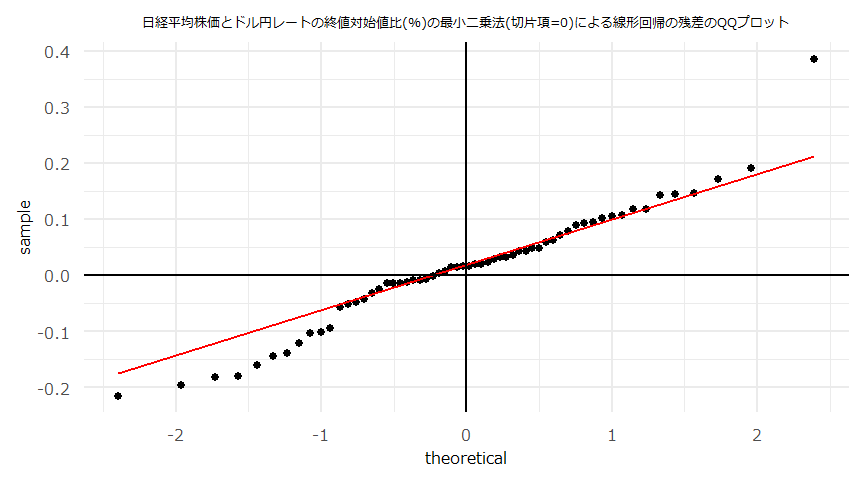
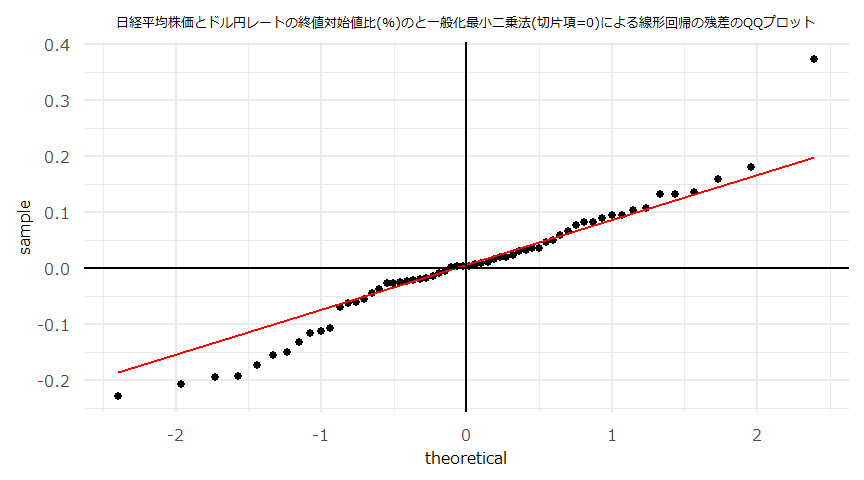
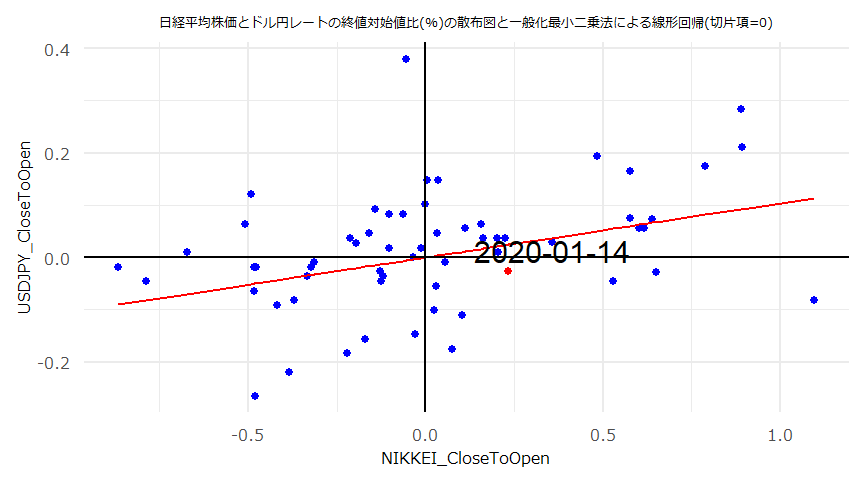
X-squared = 4.8204, df = 10, p-value = 0.9028- 切片項\(=0\)
MODEL INFO:
Observations: 60
Dependent Variable: USDJPY_CloseToOpen
Type: OLS linear regression

MODEL FIT:
F(1,59) = 10.32, p = 0.00
R2 = 0.15
Adj. R2 = 0.13

Standard errors: OLS
--------------------------------------------------------------
                           Est.   2.5%   97.5%   t val.      p
------------------------ ------ ------ ------- -------- ------
NIKKEI_CloseToOpen         0.10   0.04    0.17     3.21   0.00
--------------------------------------------------------------
    Durbin-Watson test

data:  OLS_Model_no_intercept
DW = 2.2613, p-value = 0.8764
alternative hypothesis: true autocorrelation is greater than 0
    One-sample Kolmogorov-Smirnov test

data:  ResidualsOLS_no_intercept
D = 0.16102, p-value = 0.07945
alternative hypothesis: two-sided
2.5 % 97.5 %
NIKKEI_CloseToOpen 0.03914864 0.1684451
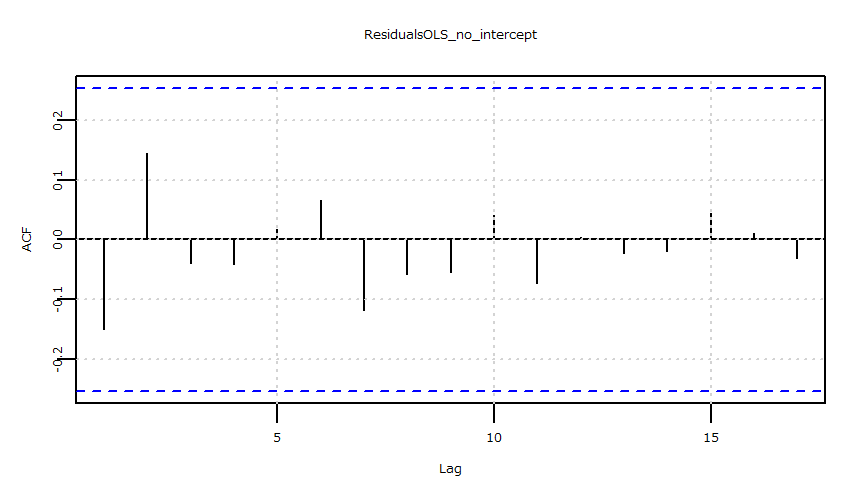
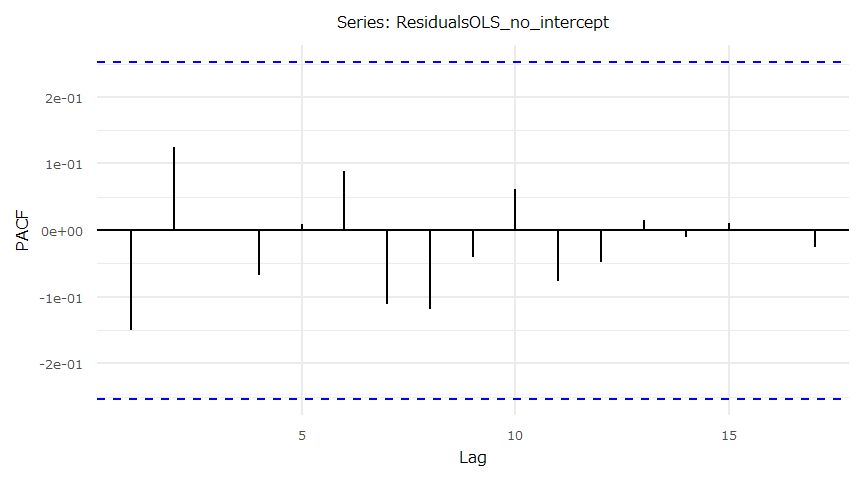
    Box-Ljung test

data:  ResidualsOLS_no_intercept
X-squared = 4.8675, df = 10, p-value = 0.8999
一般化最小二乗法
- gls {nlme}
- corARMA {nlme}
- ks.test {stats}
- confint {stats}
- Box.test {stats}
- 残差の系列相関の有無に拘わらず一般化最小二乗法による回帰係数を求めています。
- 最小二乗法の残差に系列相関が見られない場合、ここではAR(\(p=0,q=0\))の結果(AIC最小)が表示されます。
- http://user.keio.ac.jp/~nagakura/zemi/GLS.pdf
- http://tokyox.matrix.jp/wiki/index.php?%E4%B8%80%E8%88%AC%E5%8C%96%E6%9C%80%E5%B0%8F%E4%BA%8C%E4%B9%97%E6%B3%95
- 切片項\(\neq0\)
Generalized least squares fit by REML
  Model: USDJPY_CloseToOpen ~ NIKKEI_CloseToOpen
  Data: USDJPY_NIKKEI
        AIC       BIC   logLik
  -82.44287 -76.26154 44.22144

Coefficients:
                        Value  Std.Error  t-value p-value
(Intercept)        0.01235226 0.01379390 0.895487  0.3742
NIKKEI_CloseToOpen 0.10258110 0.03239088 3.166974  0.0025

 Correlation:
                   (Intr)
NIKKEI_CloseToOpen -0.042

Standardized residuals:
        Min          Q1         Med          Q3         Max
-2.13586877 -0.45194474  0.03045638  0.56445902  3.49675532

Residual standard error: 0.1067532
Degrees of freedom: 60 total; 58 residual
    One-sample Kolmogorov-Smirnov test

data:  ResidualsGLS
D = 0.11564, p-value = 0.3702
alternative hypothesis: two-sided
2.5 % 97.5 %
(Intercept) -0.01468328 0.0393878
NIKKEI_CloseToOpen 0.03909613 0.1660661
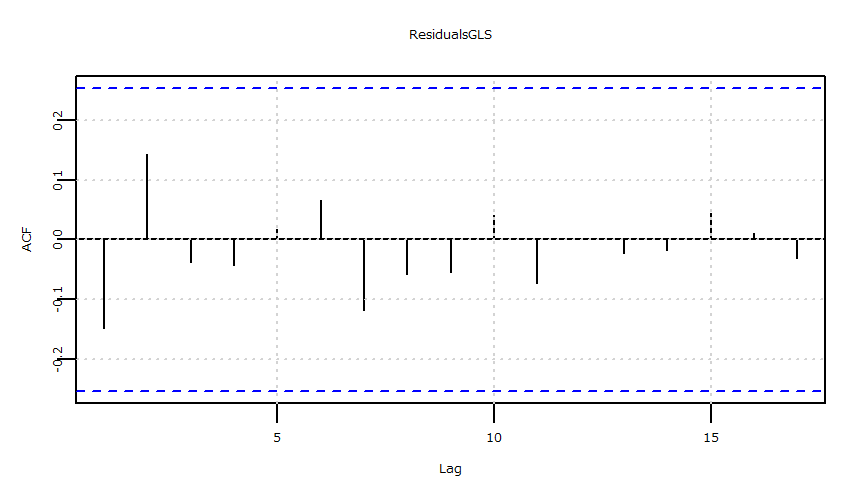
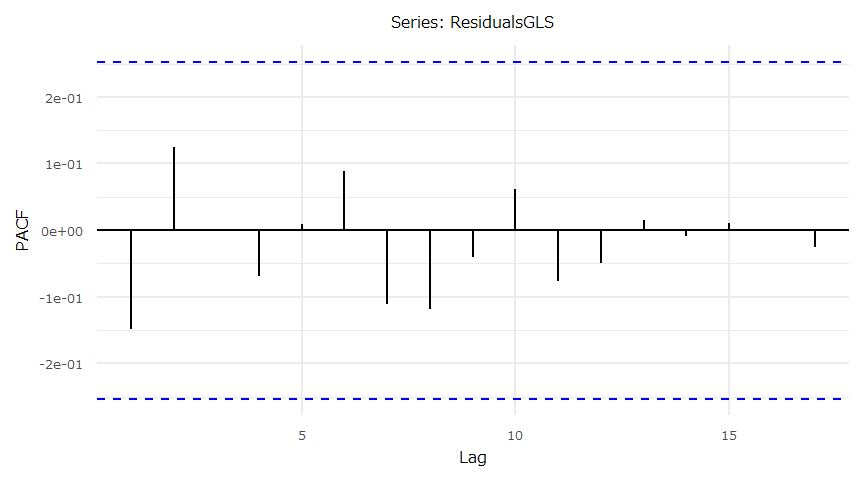
    Box-Ljung test

data:  ResidualsGLS
X-squared = 4.8204, df = 10, p-value = 0.9028- 切片項\(=0\)
Generalized least squares fit by REML
  Model: USDJPY_CloseToOpen ~ NIKKEI_CloseToOpen - 1
  Data: USDJPY_NIKKEI
        AIC       BIC   logLik
  -90.37049 -86.21542 47.18525

Coefficients:
                       Value  Std.Error  t-value p-value
NIKKEI_CloseToOpen 0.1037969 0.03230804 3.212726  0.0021

Standardized residuals:
       Min         Q1        Med         Q3        Max
-2.0180730 -0.3346773  0.1470898  0.6906384  3.6191714

Residual standard error: 0.1065738
Degrees of freedom: 60 total; 59 residual
    One-sample Kolmogorov-Smirnov test

data:  ResidualsGLS_no_intercept
D = 0.16102, p-value = 0.07945
alternative hypothesis: two-sided
2.5 % 97.5 %
NIKKEI_CloseToOpen 0.04047429 0.1671195
Box-Ljung test
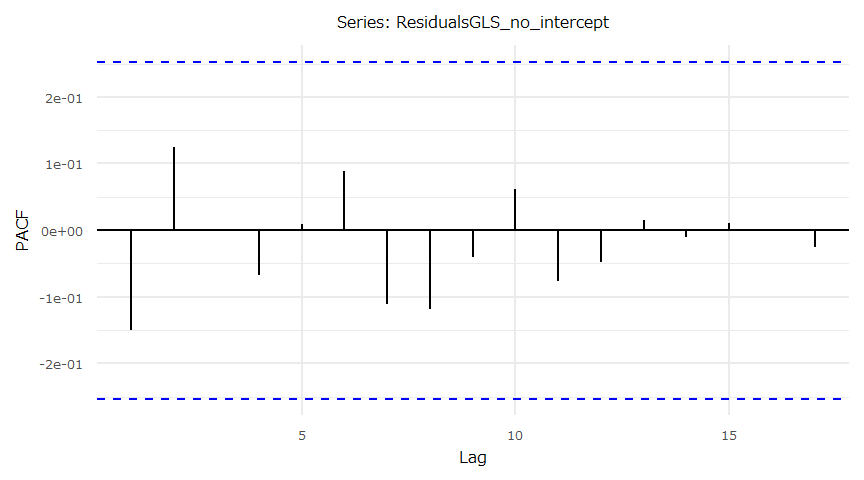
data: ResidualsGLS_no_intercept
X-squared = 4.8675, df = 10, p-value = 0.8999散布図・QQプロット・残差の時系列推移
- (注意)線形回帰の傾き(\(a\))、切片(\(b\))それぞれの検定統計量、p値に関わらず\(y=ax+b\)とした回帰直線やその残差を散布図、QQプロット等にプロットしています。
- 散布図とQQプロット

- 残差の自己相関(ACF)


- 残差の自己相関(PACF)

分析設計