Sys.time()[1] "2024-02-10 14:15:03 JST"Table 1 shows the population of Japan in each of the five age groups as of October 1, 2020.
In terms of total population, the most populous age group is the 45-49 age group with 9,650,293 persons, or 7.7% of the total population.
The so-called working-age population between the ages of 15 and 64 is 72,922,764, or 57.8% of the total population.
Table 2 and Table 3 show the population by 5-year age groups for men and women, respectively.
For men, the most populous age group is the 45-49 age group with 4,862,990 persons, accounting for 7.9% of the total male population, while for women, the most populous age group is the same as for men, 45-49 with 4,787,303, accounting for 7.4% of the total female population.
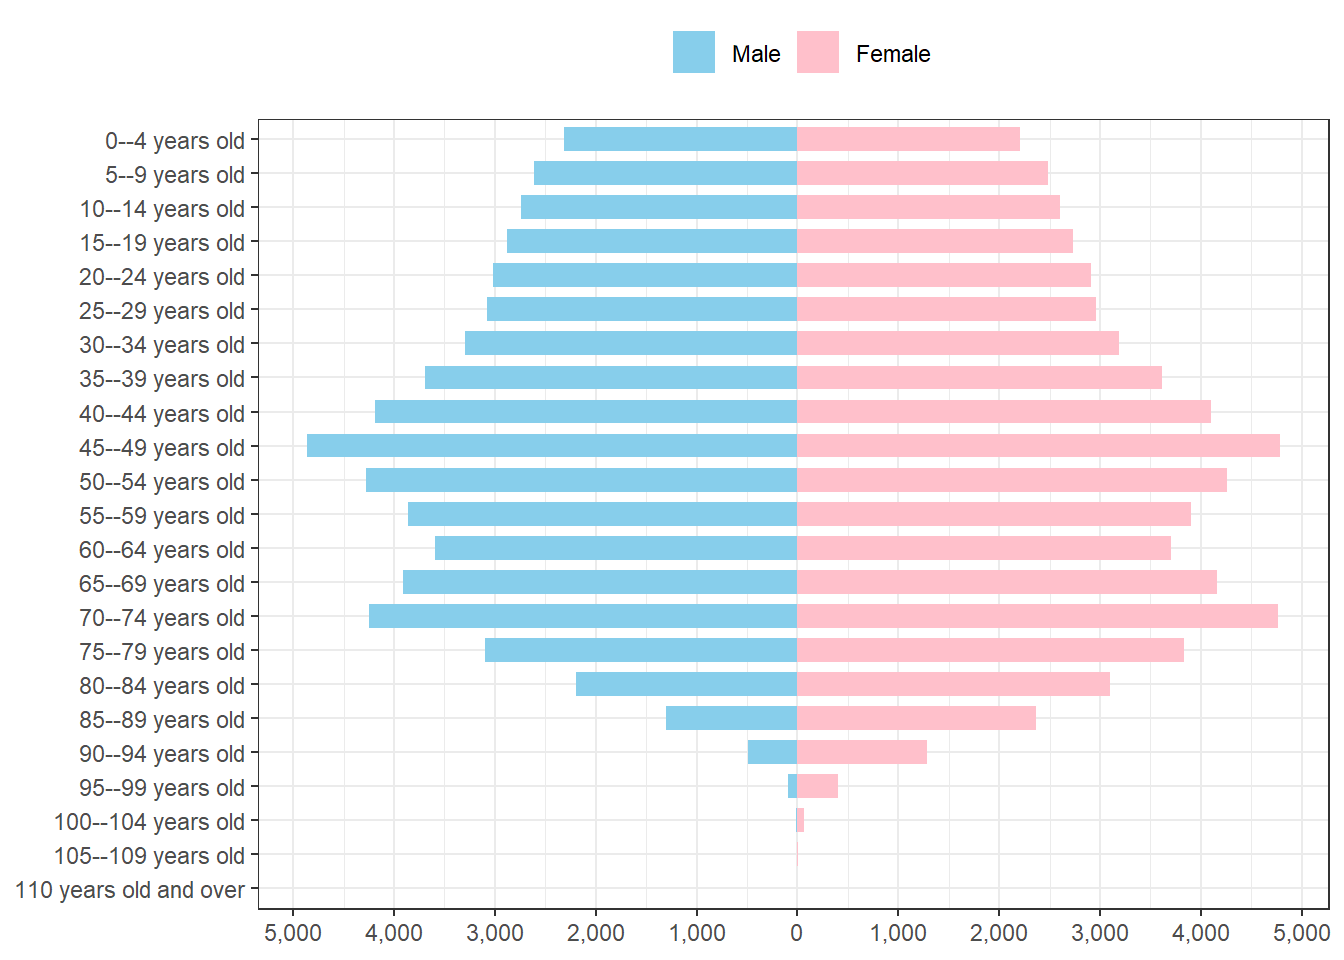
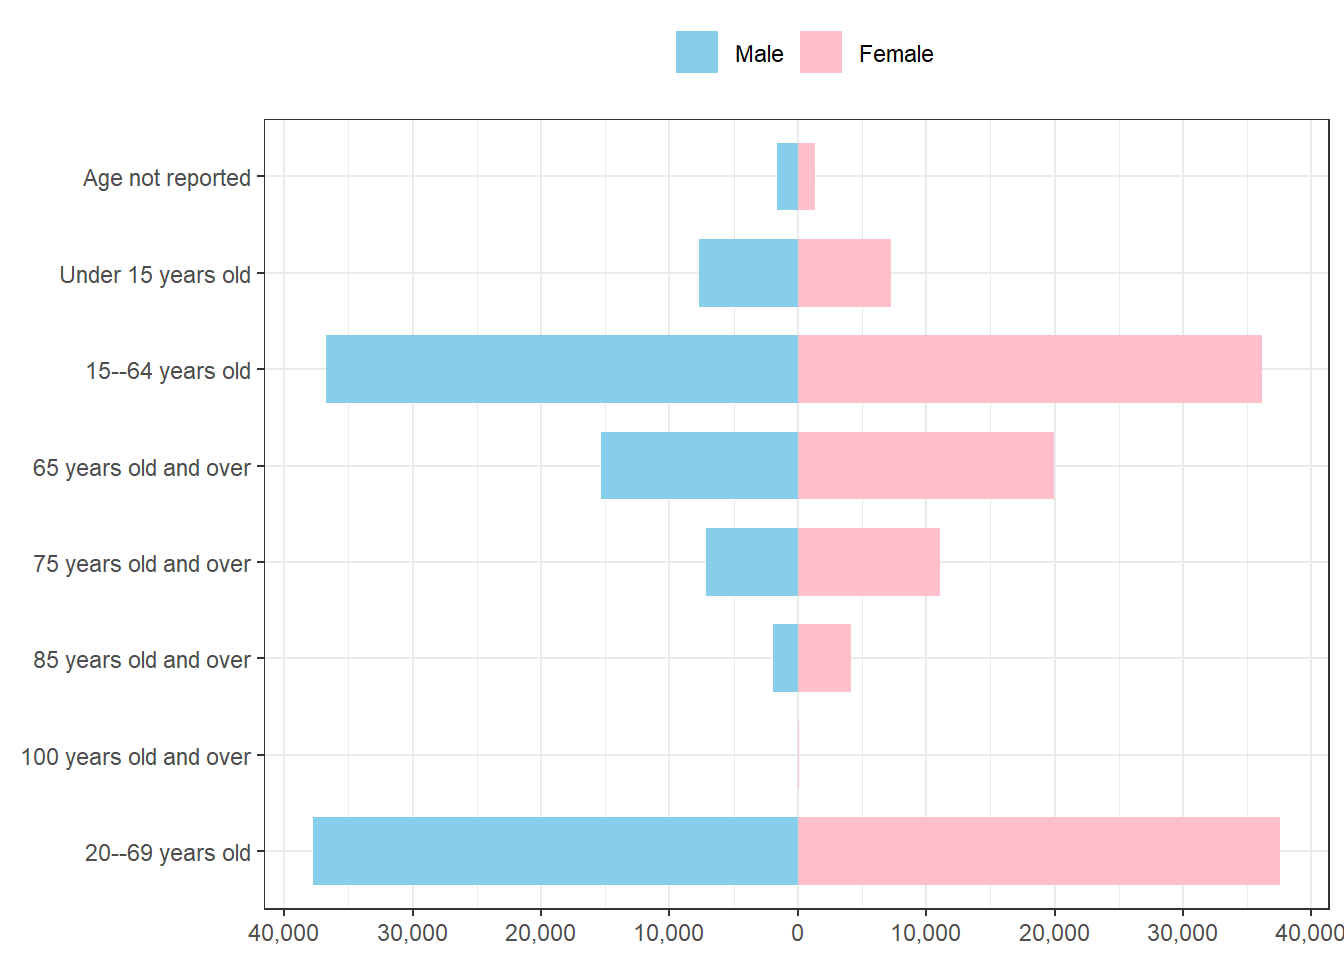
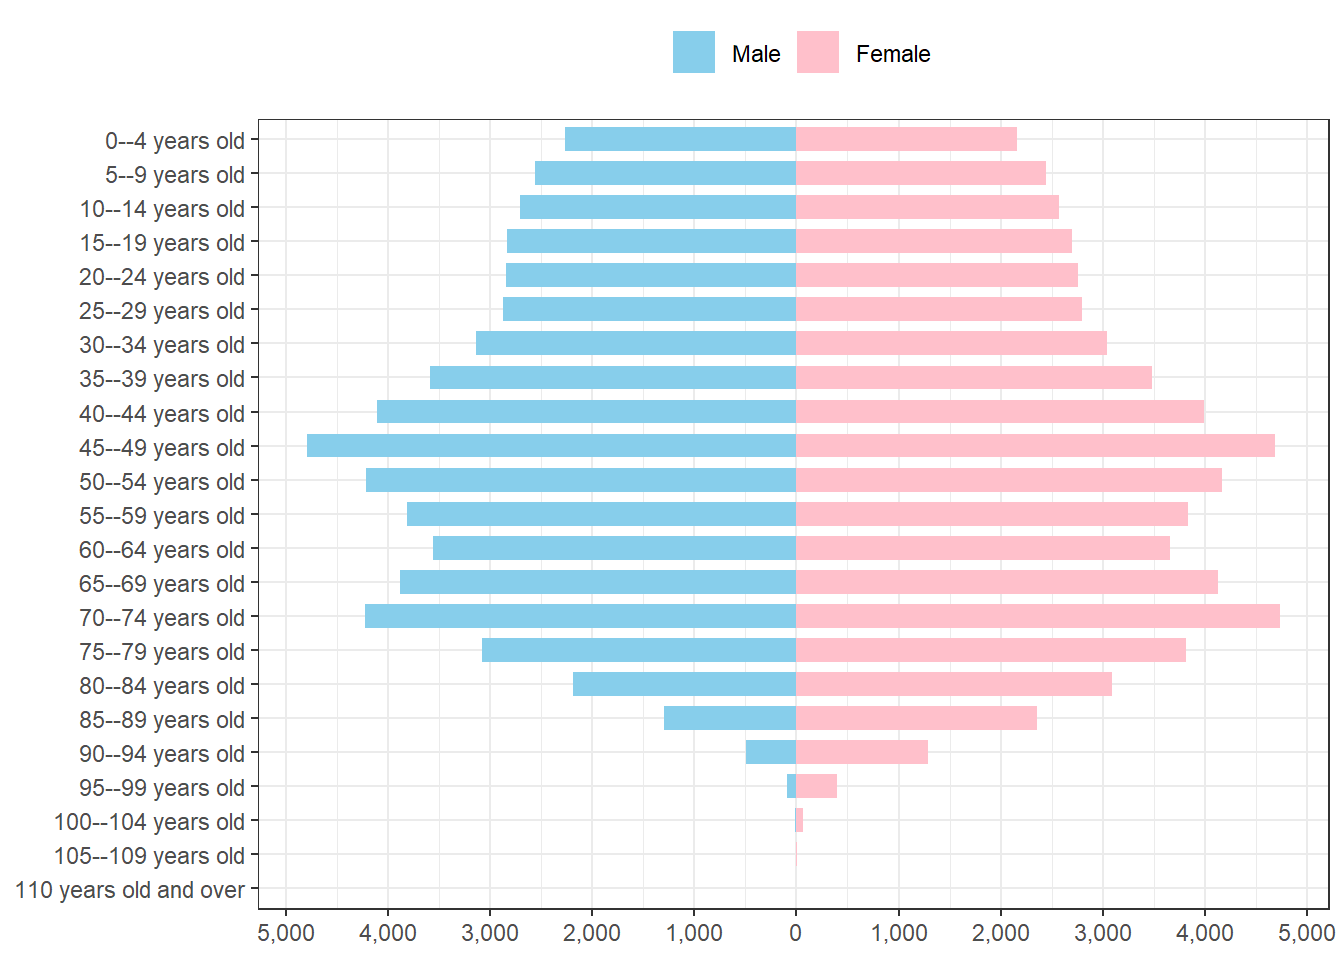
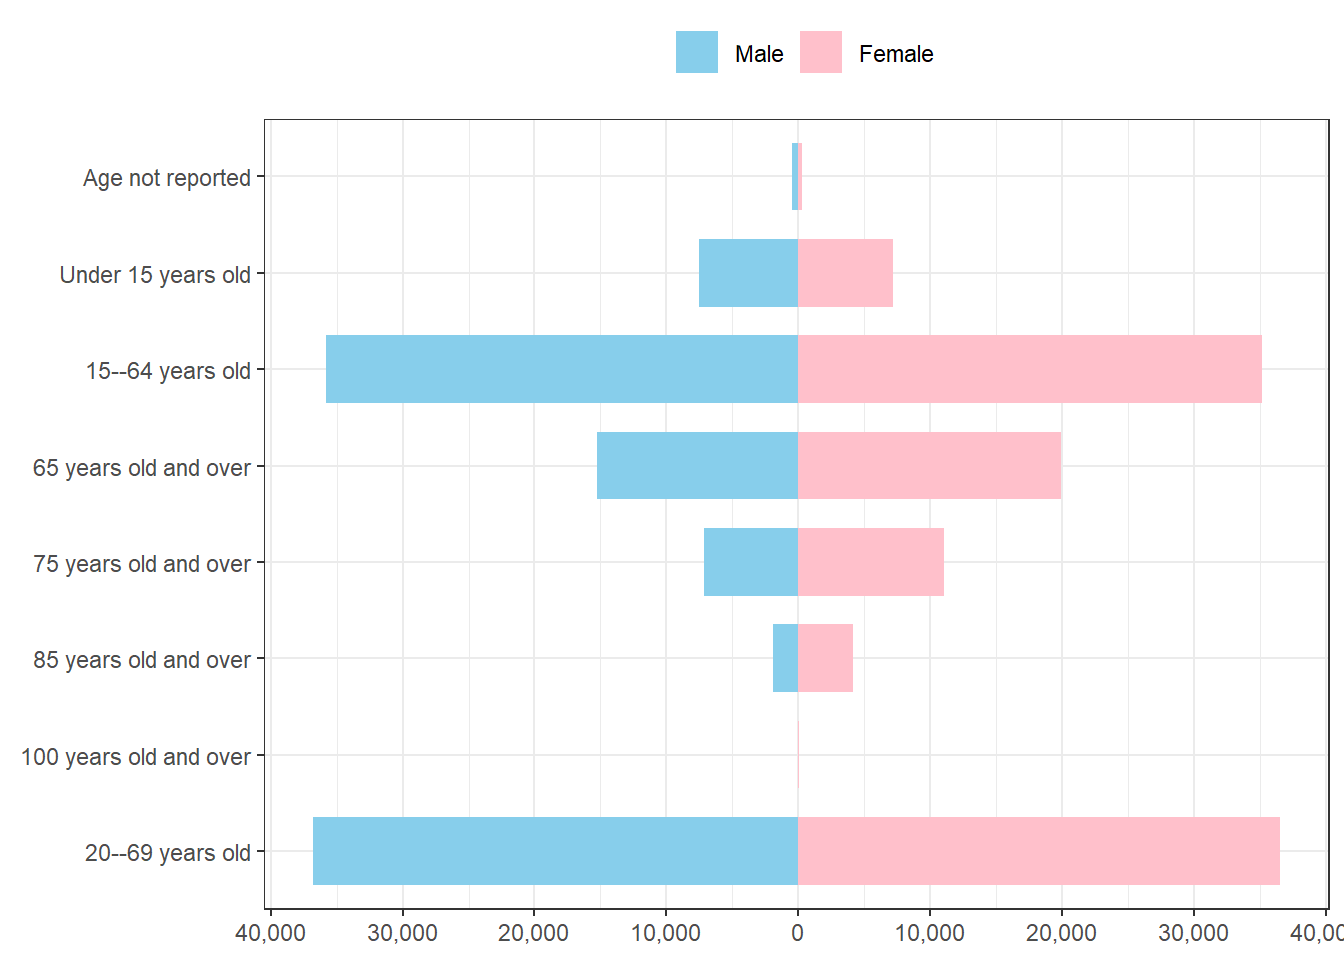
Figure 1 and Figure 2 show the population pyramid of the total Japanese population, while Figure 3 and Figure 4 show the population pyramid of the Japanese population only.
These figures alone confirm Japan’s declining population trend and rising old-age population ratio.
Since there are people of unknown nationality, subtracting the Japanese population from the total population does not result in a foreign nationality population.
| Age | Total | Japanese | Total | Japanese | |
|---|---|---|---|---|---|
| 1 | Total | 126,146,099 | 121,541,155 | 100.0 | 100.0 |
| 2 | 0--4 years old | 4,516,082 | 4,424,105 | 3.6 | 3.6 |
| 3 | 5--9 years old | 5,089,093 | 5,003,731 | 4.0 | 4.1 |
| 4 | 10--14 years old | 5,350,517 | 5,280,076 | 4.2 | 4.3 |
| 5 | 15--19 years old | 5,617,440 | 5,529,345 | 4.5 | 4.5 |
| 6 | 20--24 years old | 5,931,306 | 5,592,715 | 4.7 | 4.6 |
| 7 | 25--29 years old | 6,031,964 | 5,667,309 | 4.8 | 4.7 |
| 8 | 30--34 years old | 6,484,594 | 6,179,323 | 5.1 | 5.1 |
| 9 | 35--39 years old | 7,311,567 | 7,069,081 | 5.8 | 5.8 |
| 10 | 40--44 years old | 8,291,077 | 8,093,834 | 6.6 | 6.7 |
| 11 | 45--49 years old | 9,650,293 | 9,476,480 | 7.7 | 7.8 |
| 12 | 50--54 years old | 8,539,851 | 8,385,191 | 6.8 | 6.9 |
| 13 | 55--59 years old | 7,767,482 | 7,648,608 | 6.2 | 6.3 |
| 14 | 60--64 years old | 7,297,190 | 7,215,153 | 5.8 | 5.9 |
| 15 | 65--69 years old | 8,075,268 | 8,014,003 | 6.4 | 6.6 |
| 16 | 70--74 years old | 9,011,795 | 8,965,680 | 7.1 | 7.4 |
| 17 | 75--79 years old | 6,930,928 | 6,898,696 | 5.5 | 5.7 |
| 18 | 80--84 years old | 5,296,728 | 5,275,289 | 4.2 | 4.3 |
| 19 | 85--89 years old | 3,669,823 | 3,657,911 | 2.9 | 3.0 |
| 20 | 90--94 years old | 1,779,016 | 1,773,894 | 1.4 | 1.5 |
| 21 | 95--99 years old | 492,724 | 491,488 | 0.4 | 0.4 |
| 22 | 100--104 years old | 73,008 | 72,833 | 0.1 | 0.1 |
| 23 | 105--109 years old | 6,374 | 6,353 | 0.0 | 0.0 |
| 24 | 110 years old and over | 141 | 141 | 0.0 | 0.0 |
| 25 | Age not reported | 2,931,838 | 819,916 | 2.3 | 0.7 |
| 26 | Under 15 years old | 14,955,692 | 14,707,912 | 11.9 | 12.1 |
| 27 | 15--64 years old | 72,922,764 | 70,857,039 | 57.8 | 58.3 |
| 28 | 65 years old and over | 35,335,805 | 35,156,288 | 28.0 | 28.9 |
| 29 | 75 years old and over | 18,248,742 | 18,176,605 | 14.5 | 15.0 |
| 30 | 85 years old and over | 6,021,086 | 6,002,620 | 4.8 | 4.9 |
| 31 | 100 years old and over | 79,523 | 79,327 | 0.1 | 0.1 |
| 32 | 20--69 years old | 75,380,592 | 73,341,697 | 59.8 | 60.3 |
| Age | Total | Japanese | Total | Japanese | |
|---|---|---|---|---|---|
| 1 | Total | 61,349,581 | 59,075,539 | 100.0 | 100.0 |
| 2 | 0--4 years old | 2,311,189 | 2,264,145 | 3.8 | 3.8 |
| 3 | 5--9 years old | 2,606,651 | 2,562,581 | 4.2 | 4.3 |
| 4 | 10--14 years old | 2,742,131 | 2,705,865 | 4.5 | 4.6 |
| 5 | 15--19 years old | 2,880,029 | 2,835,255 | 4.7 | 4.8 |
| 6 | 20--24 years old | 3,017,869 | 2,838,832 | 4.9 | 4.8 |
| 7 | 25--29 years old | 3,074,087 | 2,875,451 | 5.0 | 4.9 |
| 8 | 30--34 years old | 3,297,031 | 3,138,230 | 5.4 | 5.3 |
| 9 | 35--39 years old | 3,696,855 | 3,583,229 | 6.0 | 6.1 |
| 10 | 40--44 years old | 4,189,446 | 4,104,771 | 6.8 | 6.9 |
| 11 | 45--49 years old | 4,862,990 | 4,792,505 | 7.9 | 8.1 |
| 12 | 50--54 years old | 4,277,003 | 4,217,400 | 7.0 | 7.1 |
| 13 | 55--59 years old | 3,865,303 | 3,817,458 | 6.3 | 6.5 |
| 14 | 60--64 years old | 3,592,903 | 3,558,734 | 5.9 | 6.0 |
| 15 | 65--69 years old | 3,910,060 | 3,883,159 | 6.4 | 6.6 |
| 16 | 70--74 years old | 4,249,286 | 4,228,188 | 6.9 | 7.2 |
| 17 | 75--79 years old | 3,092,860 | 3,079,388 | 5.0 | 5.2 |
| 18 | 80--84 years old | 2,196,093 | 2,187,890 | 3.6 | 3.7 |
| 19 | 85--89 years old | 1,303,473 | 1,299,513 | 2.1 | 2.2 |
| 20 | 90--94 years old | 491,303 | 489,648 | 0.8 | 0.8 |
| 21 | 95--99 years old | 92,110 | 91,813 | 0.2 | 0.2 |
| 22 | 100--104 years old | 9,051 | 9,012 | 0.0 | 0.0 |
| 23 | 105--109 years old | 714 | 706 | 0.0 | 0.0 |
| 24 | 110 years old and over | 1 | 1 | 0.0 | 0.0 |
| 25 | Age not reported | 1,591,143 | 511,765 | 2.6 | 0.9 |
| 26 | Under 15 years old | 7,659,971 | 7,532,591 | 12.5 | 12.8 |
| 27 | 15--64 years old | 36,753,516 | 35,761,865 | 59.9 | 60.5 |
| 28 | 65 years old and over | 15,344,951 | 15,269,318 | 25.0 | 25.8 |
| 29 | 75 years old and over | 7,185,605 | 7,157,971 | 11.7 | 12.1 |
| 30 | 85 years old and over | 1,896,652 | 1,890,693 | 3.1 | 3.2 |
| 31 | 100 years old and over | 9,766 | 9,719 | 0.0 | 0.0 |
| 32 | 20--69 years old | 37,783,547 | 36,809,769 | 61.6 | 62.3 |
| Age | Total | Japanese | Total | Japanese | |
|---|---|---|---|---|---|
| 1 | Total | 64,796,518 | 62,465,616 | 100.0 | 100.0 |
| 2 | 0--4 years old | 2,204,893 | 2,159,960 | 3.4 | 3.5 |
| 3 | 5--9 years old | 2,482,442 | 2,441,150 | 3.8 | 3.9 |
| 4 | 10--14 years old | 2,608,386 | 2,574,211 | 4.0 | 4.1 |
| 5 | 15--19 years old | 2,737,411 | 2,694,090 | 4.2 | 4.3 |
| 6 | 20--24 years old | 2,913,437 | 2,753,883 | 4.5 | 4.4 |
| 7 | 25--29 years old | 2,957,877 | 2,791,858 | 4.6 | 4.5 |
| 8 | 30--34 years old | 3,187,563 | 3,041,093 | 4.9 | 4.9 |
| 9 | 35--39 years old | 3,614,712 | 3,485,852 | 5.6 | 5.6 |
| 10 | 40--44 years old | 4,101,631 | 3,989,063 | 6.3 | 6.4 |
| 11 | 45--49 years old | 4,787,303 | 4,683,975 | 7.4 | 7.5 |
| 12 | 50--54 years old | 4,262,848 | 4,167,791 | 6.6 | 6.7 |
| 13 | 55--59 years old | 3,902,179 | 3,831,150 | 6.0 | 6.1 |
| 14 | 60--64 years old | 3,704,287 | 3,656,419 | 5.7 | 5.9 |
| 15 | 65--69 years old | 4,165,208 | 4,130,844 | 6.4 | 6.6 |
| 16 | 70--74 years old | 4,762,509 | 4,737,492 | 7.3 | 7.6 |
| 17 | 75--79 years old | 3,838,068 | 3,819,308 | 5.9 | 6.1 |
| 18 | 80--84 years old | 3,100,635 | 3,087,399 | 4.8 | 4.9 |
| 19 | 85--89 years old | 2,366,350 | 2,358,398 | 3.7 | 3.8 |
| 20 | 90--94 years old | 1,287,713 | 1,284,246 | 2.0 | 2.1 |
| 21 | 95--99 years old | 400,614 | 399,675 | 0.6 | 0.6 |
| 22 | 100--104 years old | 63,957 | 63,821 | 0.1 | 0.1 |
| 23 | 105--109 years old | 5,660 | 5,647 | 0.0 | 0.0 |
| 24 | 110 years old and over | 140 | 140 | 0.0 | 0.0 |
| 25 | Age not reported | 1,340,695 | 308,151 | 2.1 | 0.5 |
| 26 | Under 15 years old | 7,295,721 | 7,175,321 | 11.3 | 11.5 |
| 27 | 15--64 years old | 36,169,248 | 35,095,174 | 55.8 | 56.2 |
| 28 | 65 years old and over | 19,990,854 | 19,886,970 | 30.9 | 31.8 |
| 29 | 75 years old and over | 11,063,137 | 11,018,634 | 17.1 | 17.6 |
| 30 | 85 years old and over | 4,124,434 | 4,111,927 | 6.4 | 6.6 |
| 31 | 100 years old and over | 69,757 | 69,608 | 0.1 | 0.1 |
| 32 | 20--69 years old | 37,597,045 | 36,531,928 | 58.0 | 58.5 |
Sys.time()[1] "2024-02-10 14:15:03 JST"R.Version()$version.string[1] "R version 4.3.2 Patched (2023-12-27 r85754 ucrt)"quarto::quarto_version()[1] '1.4.542'packageVersion(pkg = "tidyverse")[1] '2.0.0'