Sys.time()[1] "2024-01-14 11:52:55 JST"Japan consists of 47 prefectures, with a total population of 126,146,099 including foreigners as of October 1, 2020.
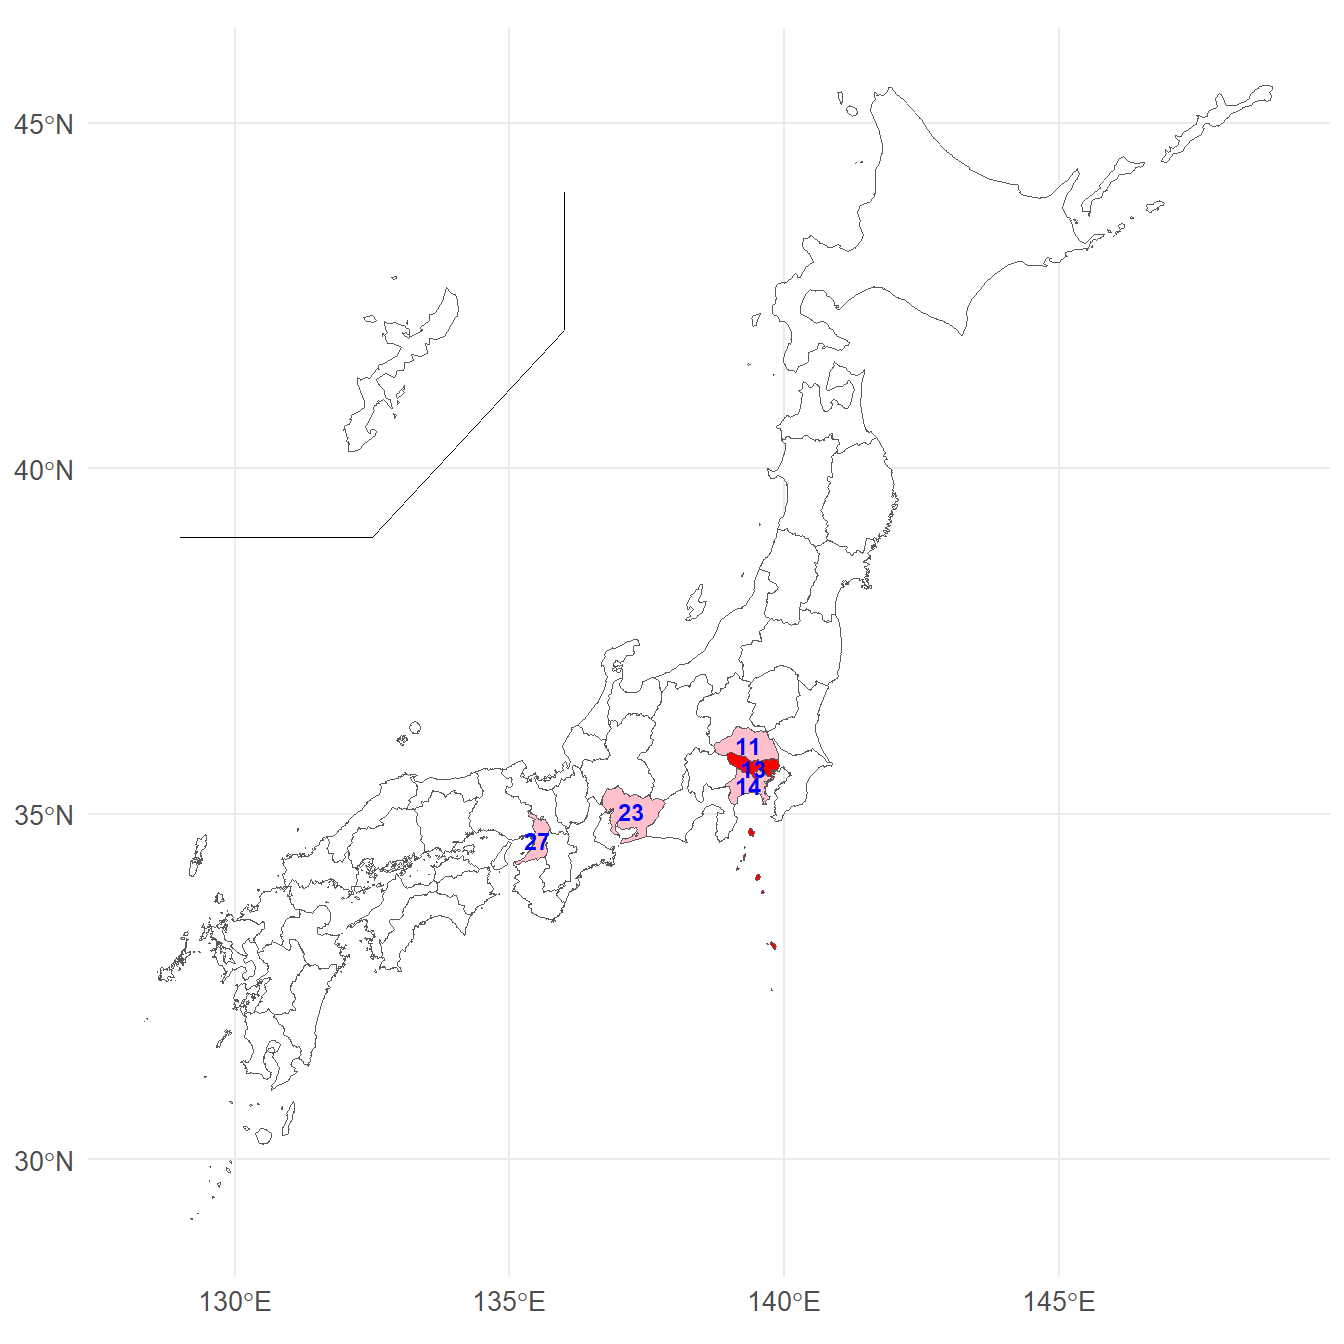
The most populous of these prefectures is Tokyo-to(Area code:13) with 14,047,594 residents (Table 1).
The red-colored area in Figure 1 shows Tokyo-to, where more than 1 in 10 of the total population lives in an area that is not very large compared to other prefectures.
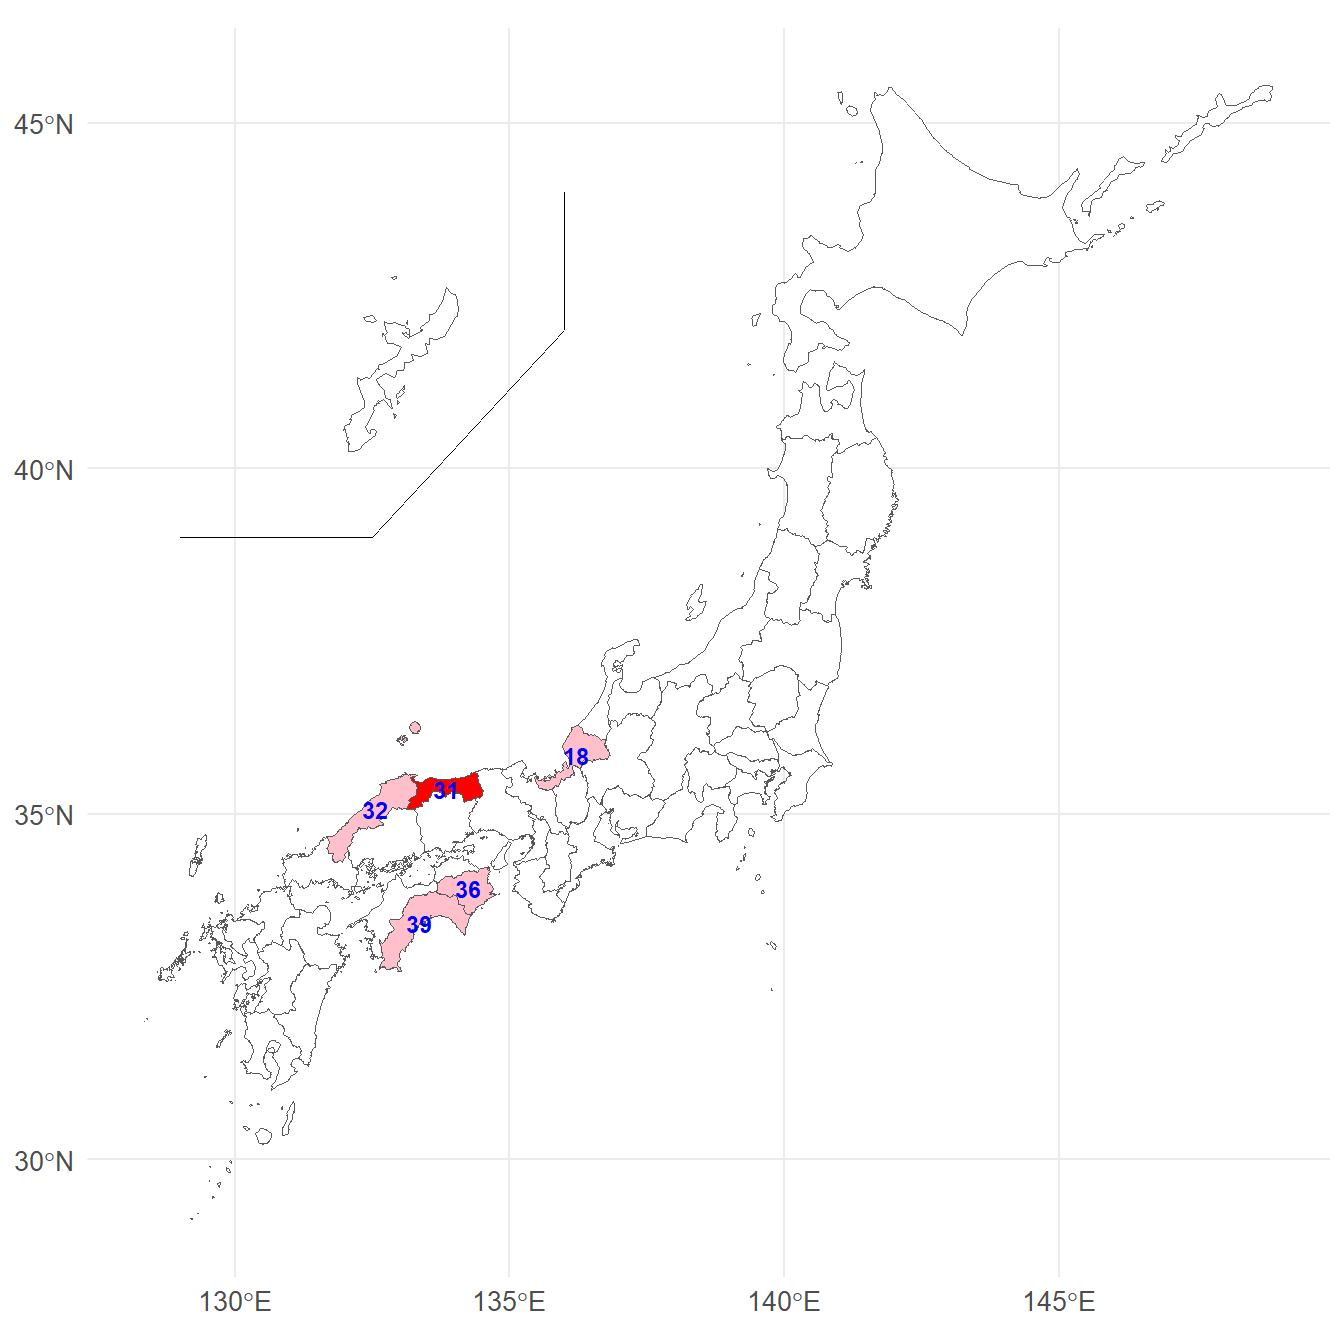
The least populated prefecture is Tottori-ken(Area code:31) with 553,407 people (Table 2, Figure 2).
Note that Figure 1 and Figure 2 are both
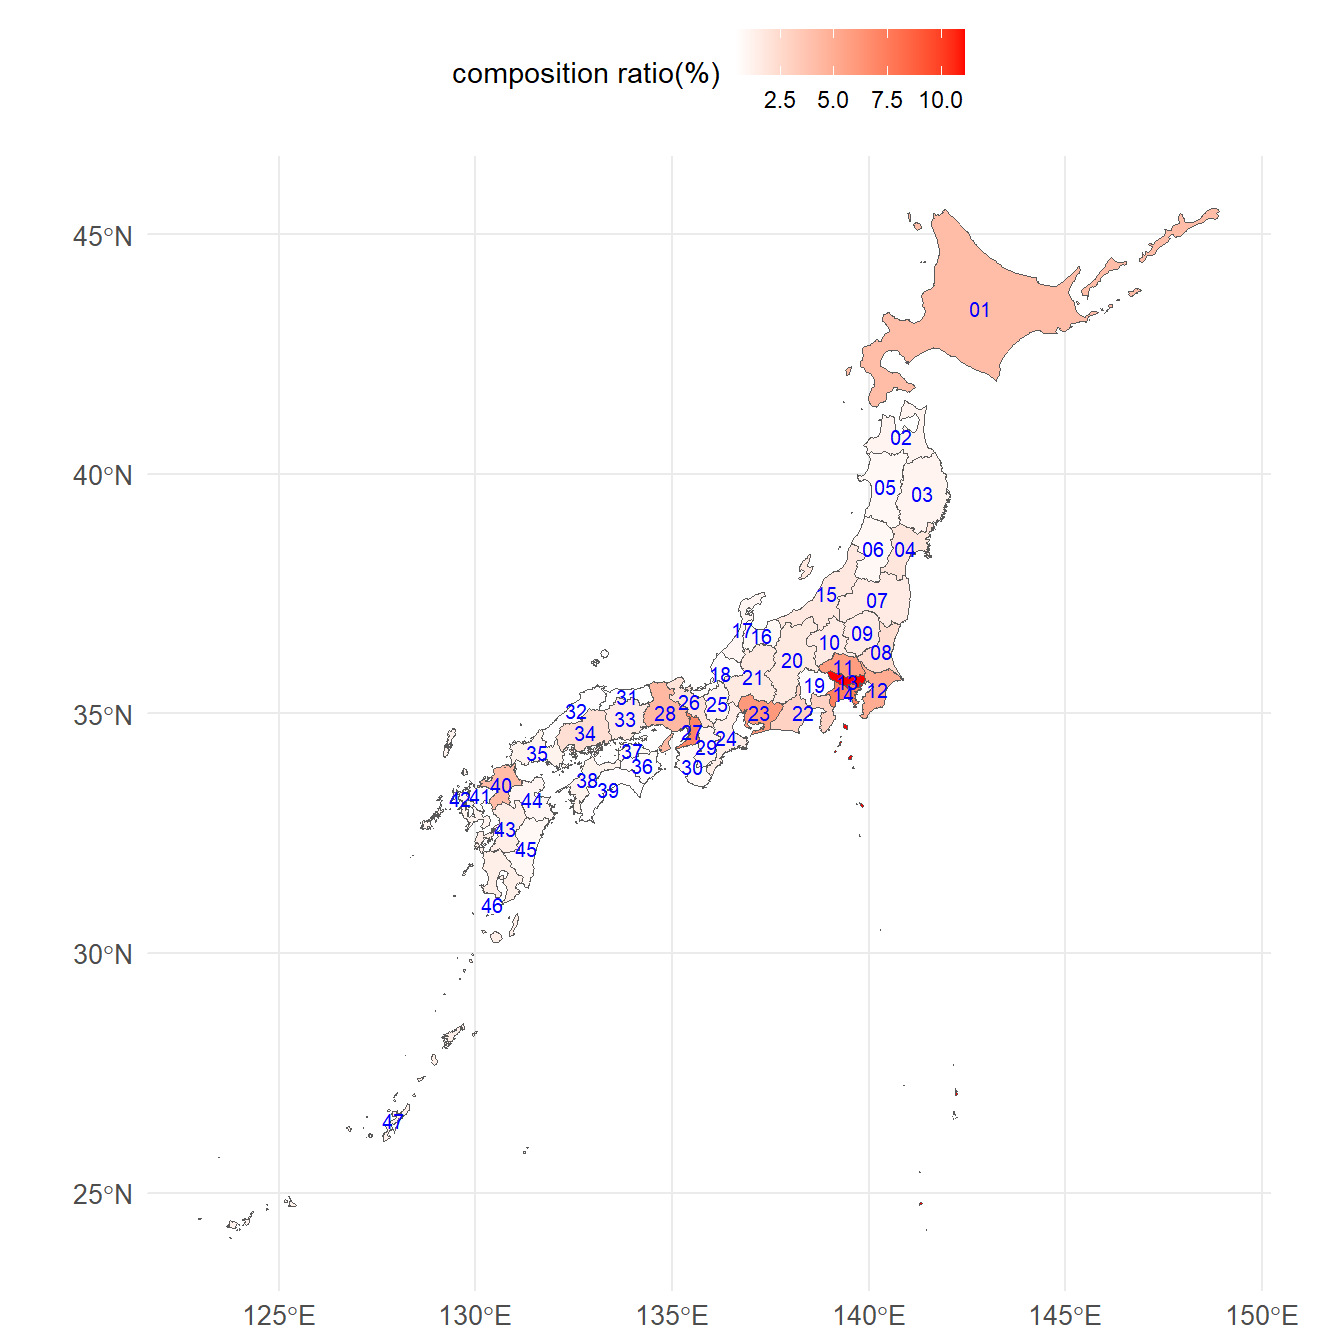
A true map of Japan that has not been cropped, enlarged, moved, or removed is a Figure 3,Table 3.
| Area code | Prefecture | Population | composition ratio(%) | |
|---|---|---|---|---|
| 1 | 13 | Tokyo-to | 14,047,594 | 11.1 |
| 2 | 14 | Kanagawa-ken | 9,237,337 | 7.3 |
| 3 | 27 | Osaka-fu | 8,837,685 | 7.0 |
| 4 | 23 | Aichi-ken | 7,542,415 | 6.0 |
| 5 | 11 | Saitama-ken | 7,344,765 | 5.8 |
| Area code | Prefecture | Population | composition ratio(%) | |
|---|---|---|---|---|
| 43 | 18 | Fukui-ken | 766,863 | 0.6 |
| 44 | 36 | Tokushima-ken | 719,559 | 0.6 |
| 45 | 39 | Kochi-ken | 691,527 | 0.5 |
| 46 | 32 | Shimane-ken | 671,126 | 0.5 |
| 47 | 31 | Tottori-ken | 553,407 | 0.4 |
| Area code | Prefecture | Population | composition ratio(%) | |
|---|---|---|---|---|
| 1 | 13 | Tokyo-to | 14,047,594 | 11.1 |
| 2 | 14 | Kanagawa-ken | 9,237,337 | 7.3 |
| 3 | 27 | Osaka-fu | 8,837,685 | 7.0 |
| 4 | 23 | Aichi-ken | 7,542,415 | 6.0 |
| 5 | 11 | Saitama-ken | 7,344,765 | 5.8 |
| 6 | 12 | Chiba-ken | 6,284,480 | 5.0 |
| 7 | 28 | Hyogo-ken | 5,465,002 | 4.3 |
| 8 | 01 | Hokkaido | 5,224,614 | 4.1 |
| 9 | 40 | Fukuoka-ken | 5,135,214 | 4.1 |
| 10 | 22 | Shizuoka-ken | 3,633,202 | 2.9 |
| 11 | 08 | Ibaraki-ken | 2,867,009 | 2.3 |
| 12 | 34 | Hiroshima-ken | 2,799,702 | 2.2 |
| 13 | 26 | Kyoto-fu | 2,578,087 | 2.0 |
| 14 | 04 | Miyagi-ken | 2,301,996 | 1.8 |
| 15 | 15 | Niigata-ken | 2,201,272 | 1.7 |
| 16 | 20 | Nagano-ken | 2,048,011 | 1.6 |
| 17 | 21 | Gifu-ken | 1,978,742 | 1.6 |
| 18 | 10 | Gumma-ken | 1,939,110 | 1.5 |
| 19 | 09 | Tochigi-ken | 1,933,146 | 1.5 |
| 20 | 33 | Okayama-ken | 1,888,432 | 1.5 |
| 21 | 07 | Fukushima-ken | 1,833,152 | 1.5 |
| 22 | 24 | Mie-ken | 1,770,254 | 1.4 |
| 23 | 43 | Kumamoto-ken | 1,738,301 | 1.4 |
| 24 | 46 | Kagoshima-ken | 1,588,256 | 1.3 |
| 25 | 47 | Okinawa-ken | 1,467,480 | 1.2 |
| 26 | 25 | Shiga-ken | 1,413,610 | 1.1 |
| 27 | 35 | Yamaguchi-ken | 1,342,059 | 1.1 |
| 28 | 38 | Ehime-ken | 1,334,841 | 1.1 |
| 29 | 29 | Nara-ken | 1,324,473 | 1.0 |
| 30 | 42 | Nagasaki-ken | 1,312,317 | 1.0 |
| 31 | 02 | Aomori-ken | 1,237,984 | 1.0 |
| 32 | 03 | Iwate-ken | 1,210,534 | 1.0 |
| 33 | 17 | Ishikawa-ken | 1,132,526 | 0.9 |
| 34 | 44 | Oita-ken | 1,123,852 | 0.9 |
| 35 | 45 | Miyazaki-ken | 1,069,576 | 0.8 |
| 36 | 06 | Yamagata-ken | 1,068,027 | 0.8 |
| 37 | 16 | Toyama-ken | 1,034,814 | 0.8 |
| 38 | 05 | Akita-ken | 959,502 | 0.8 |
| 39 | 37 | Kagawa-ken | 950,244 | 0.8 |
| 40 | 30 | Wakayama-ken | 922,584 | 0.7 |
| 41 | 41 | Saga-ken | 811,442 | 0.6 |
| 42 | 19 | Yamanashi-ken | 809,974 | 0.6 |
| 43 | 18 | Fukui-ken | 766,863 | 0.6 |
| 44 | 36 | Tokushima-ken | 719,559 | 0.6 |
| 45 | 39 | Kochi-ken | 691,527 | 0.5 |
| 46 | 32 | Shimane-ken | 671,126 | 0.5 |
| 47 | 31 | Tottori-ken | 553,407 | 0.4 |
Sys.time()[1] "2024-01-14 11:52:55 JST"R.Version()$version.string[1] "R version 4.3.2 Patched (2023-12-27 r85754 ucrt)"quarto::quarto_version()[1] '1.4.542'packageVersion(pkg = "tidyverse")[1] '2.0.0'