Sys.time()[1] "2024-02-04 08:59:39 JST"As of October 1, 2020, the total population of foreigners living in Japan is 2,402,460.
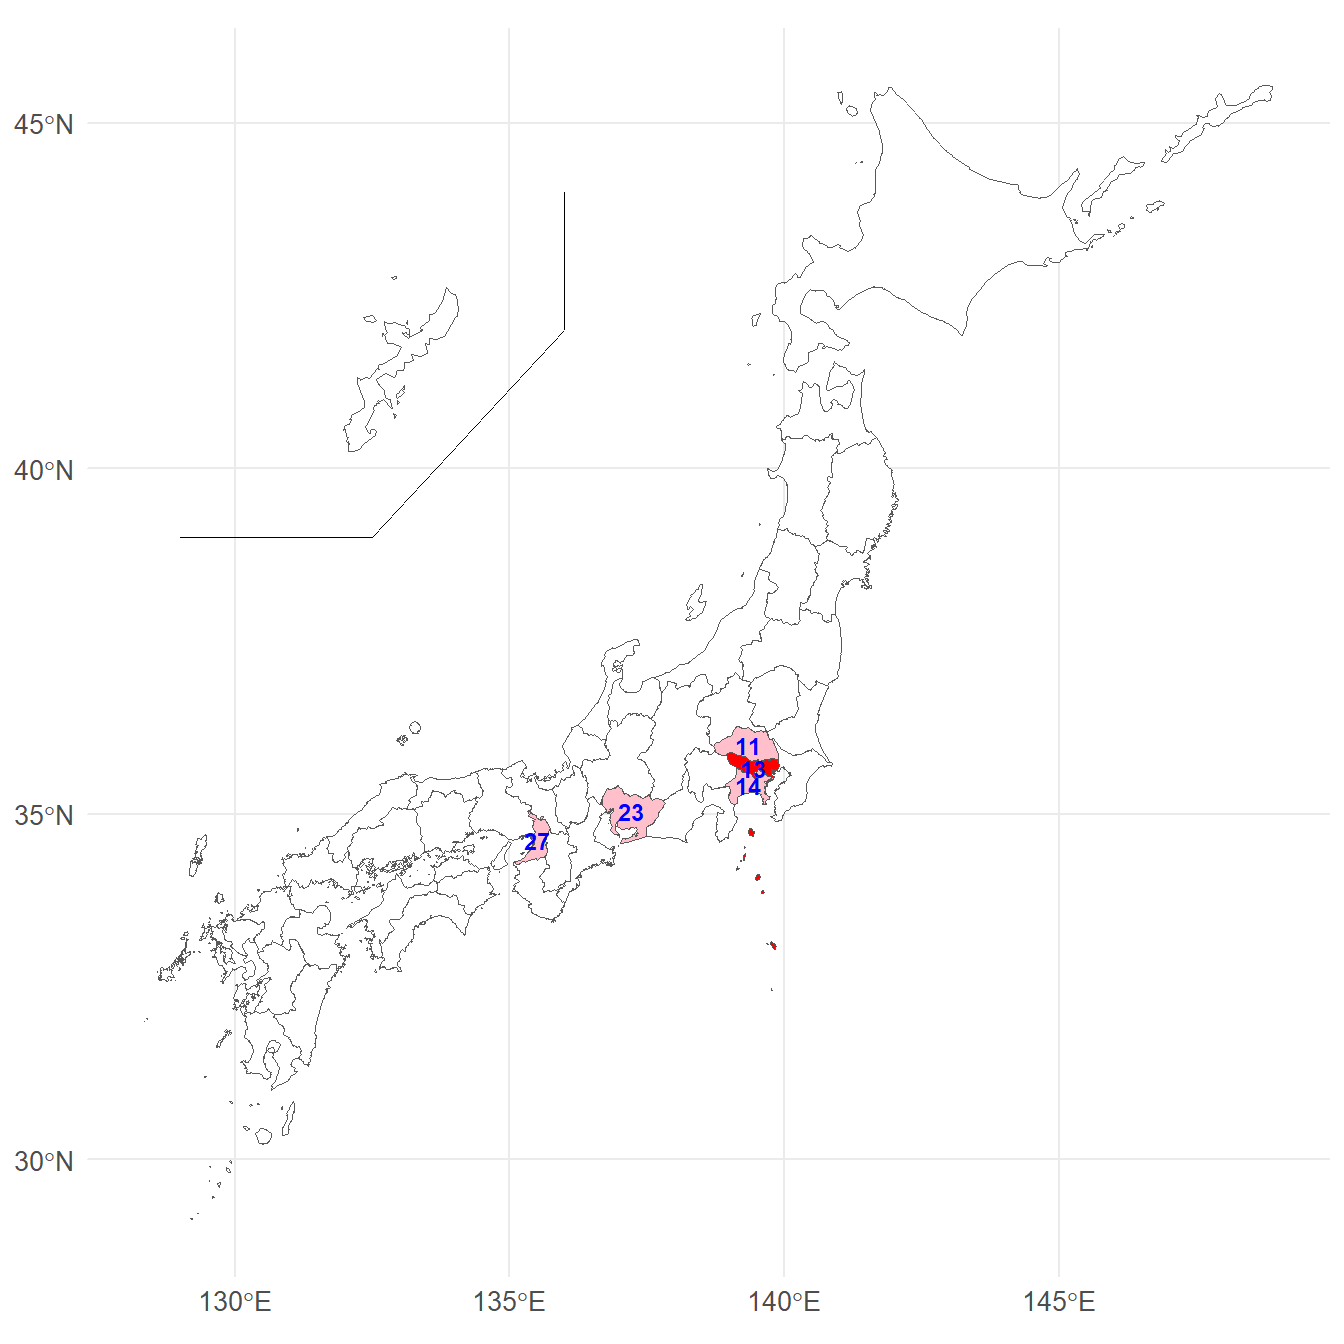
The prefecture with the largest number of foreigners living in Japan is Tokyo-to, with 483,372 people, or 20.1% of all foreigners, or more than one in five foreigners living in Japan(Table 1,Figure 1).
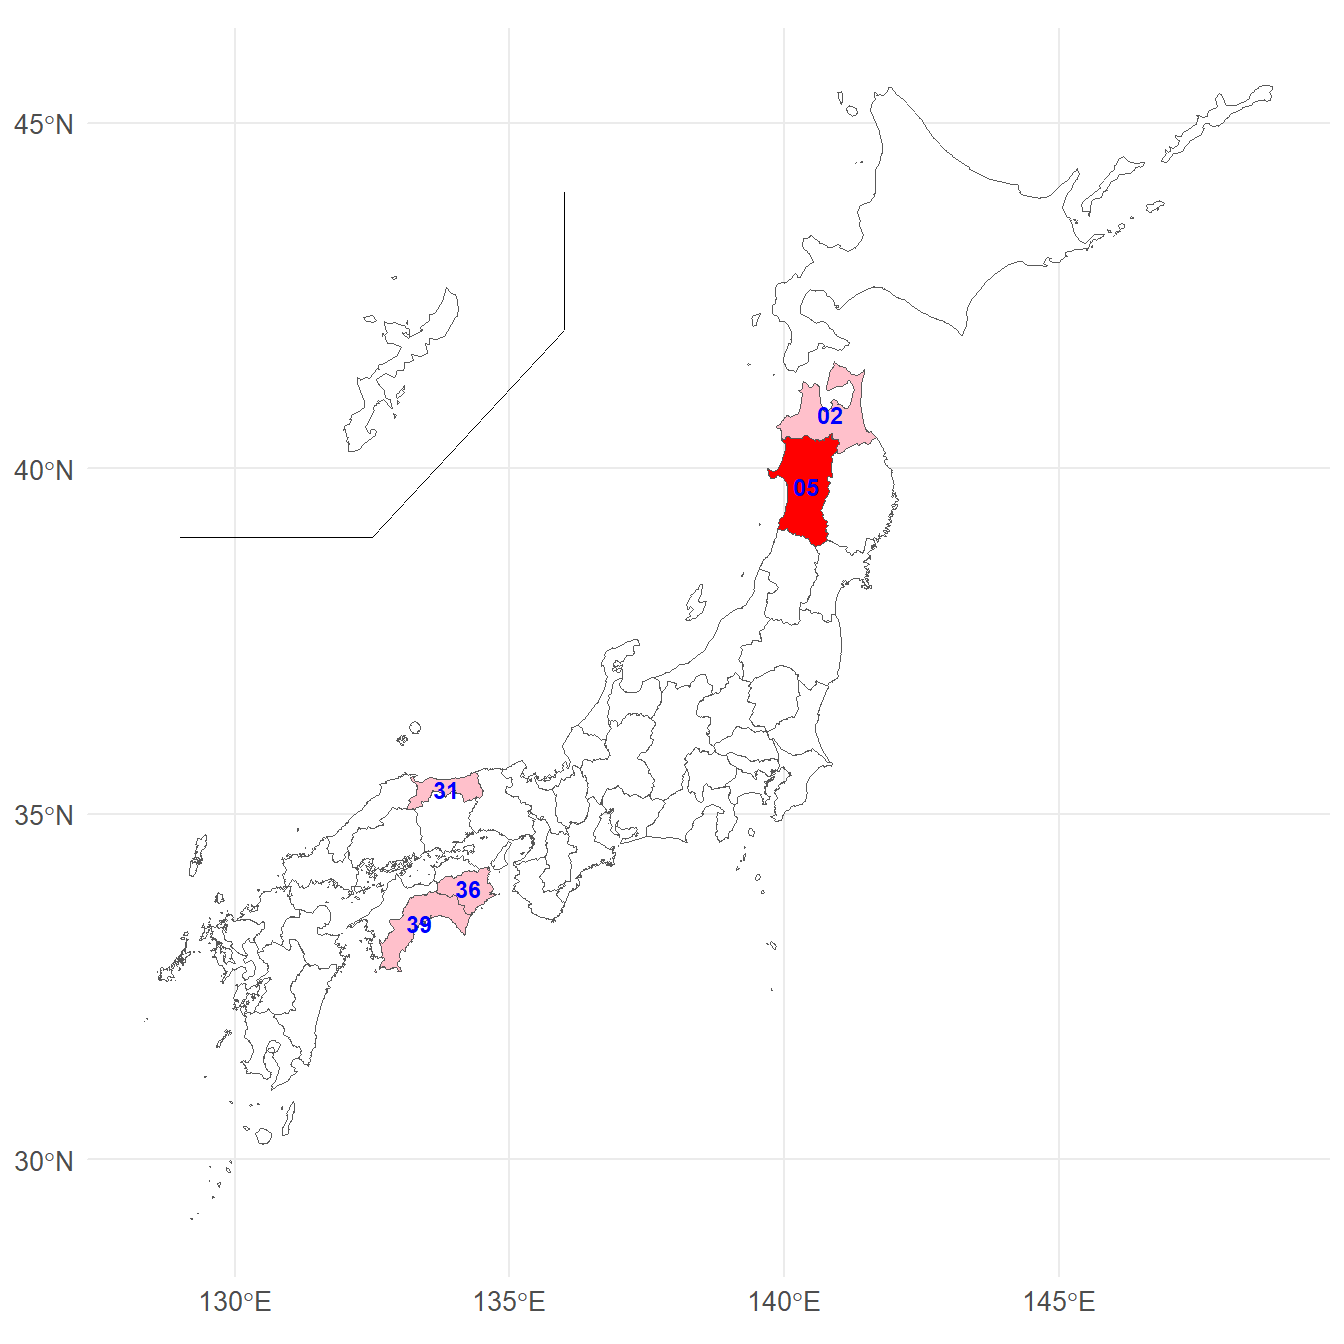
The prefecture with the least number of foreigners is Akita-ken, with 3,651 people, accounting for 0.2% of all foreigners living in Japan(Table 2,Figure 2).
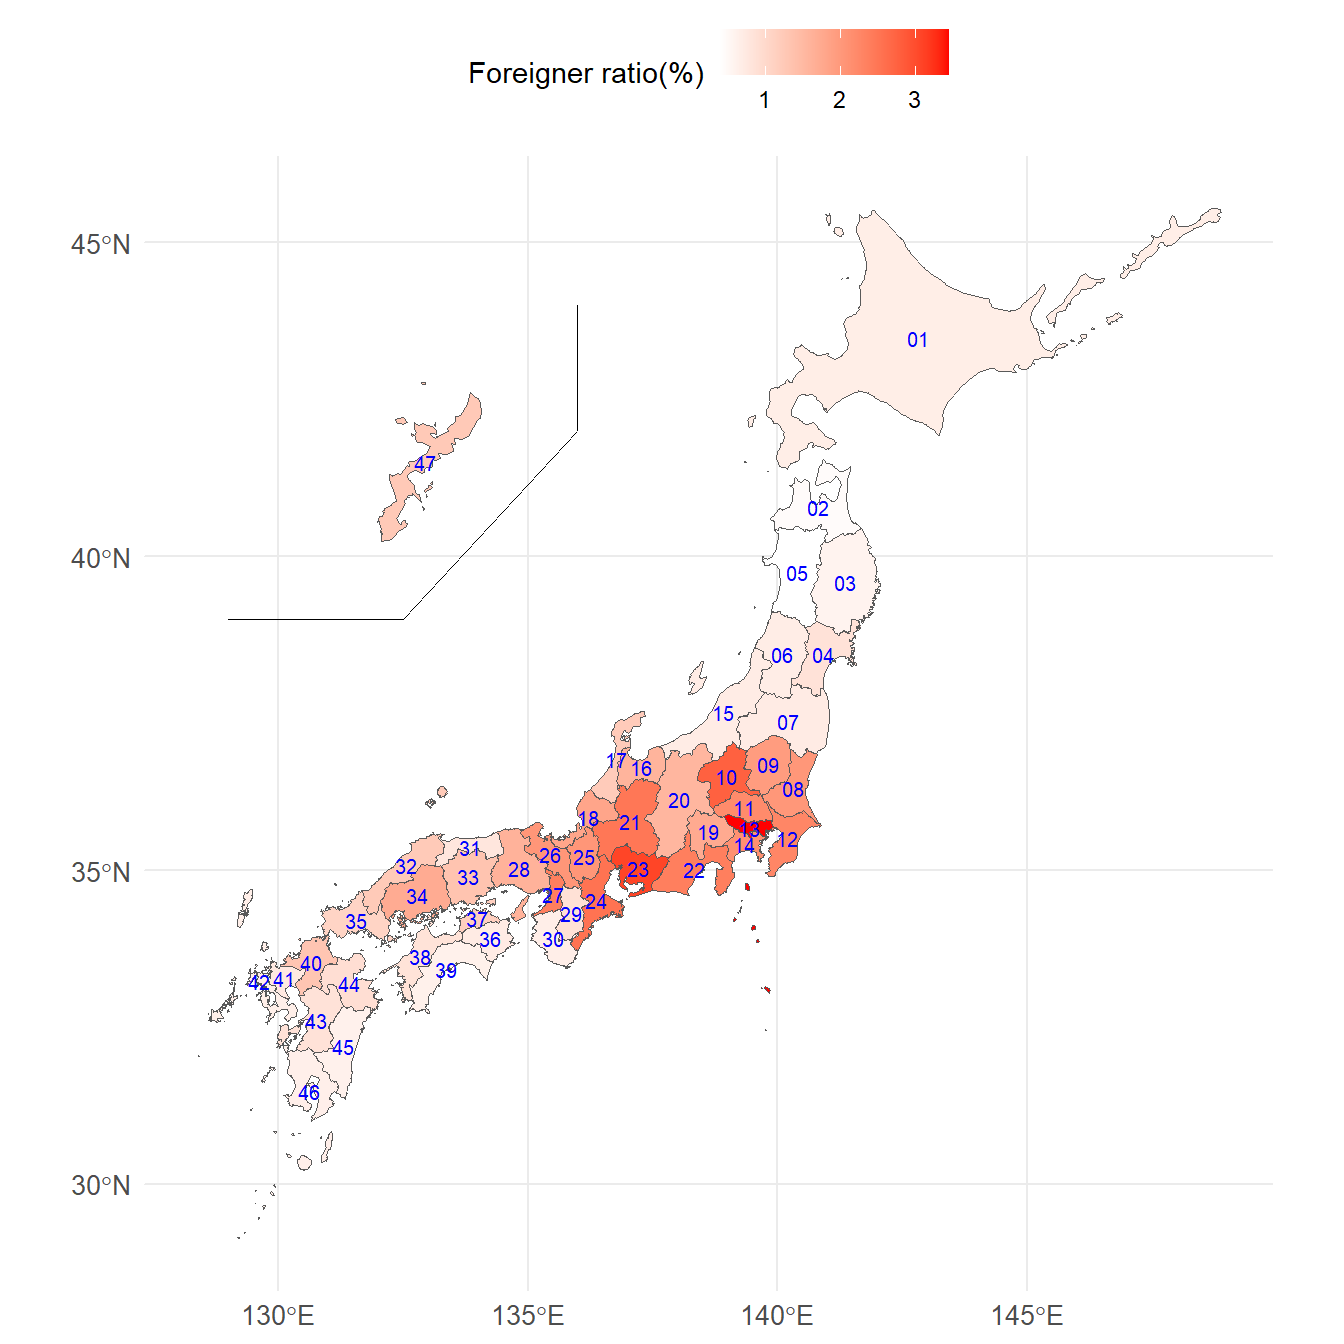
Table 3 and Figure 3 show Japan’s total population, Japanese population, foreign population, population with unknown nationality, and the ratio of foreigners and unknown nationality to the total population.
The ratio of foreigners to the total population of Japan (Area code: 00) is 1.9%.
The prefecture with the highest proportion of foreigners is Tokyo-to (Area code: 13) at 3.4%.
The lowest rate is Akita-ken (Area code: 05) at 0.4%.
Since the percentage of unknown nationality and the percentage of foreigners are about the same, we hope that more accurate nationality will be reported in the next survey.
| Area code | Prefecture | Population | composition ratio(%) | |
|---|---|---|---|---|
| 1 | 13 | Tokyo-to | 483,372 | 20.1 |
| 2 | 23 | Aichi-ken | 231,369 | 9.6 |
| 3 | 27 | Osaka-fu | 208,681 | 8.7 |
| 4 | 14 | Kanagawa-ken | 195,535 | 8.1 |
| 5 | 11 | Saitama-ken | 161,439 | 6.7 |
| Area code | Prefecture | Population | composition ratio(%) | |
|---|---|---|---|---|
| 43 | 02 | Aomori-ken | 5,409 | 0.2 |
| 44 | 36 | Tokushima-ken | 5,033 | 0.2 |
| 45 | 31 | Tottori-ken | 4,310 | 0.2 |
| 46 | 39 | Kochi-ken | 4,220 | 0.2 |
| 47 | 05 | Akita-ken | 3,651 | 0.2 |
| Area code | Prefecture | Total | Japanese | Foreigner | Nationality not reported | Foreigner ratio(%) | Nationality not reported ratio(%) | |
|---|---|---|---|---|---|---|---|---|
| 1 | 13 | Tokyo-to | 14,047,594 | 13,233,213 | 483,372 | 331,009 | 3.4 | 2.4 |
| 2 | 23 | Aichi-ken | 7,542,415 | 7,164,758 | 231,369 | 146,288 | 3.1 | 1.9 |
| 3 | 10 | Gumma-ken | 1,939,110 | 1,860,213 | 53,432 | 25,465 | 2.8 | 1.3 |
| 4 | 24 | Mie-ken | 1,770,254 | 1,698,876 | 44,721 | 26,657 | 2.5 | 1.5 |
| 5 | 21 | Gifu-ken | 1,978,742 | 1,900,727 | 48,979 | 29,036 | 2.5 | 1.5 |
| 6 | 22 | Shizuoka-ken | 3,633,202 | 3,523,817 | 86,046 | 23,339 | 2.4 | 0.6 |
| 7 | 27 | Osaka-fu | 8,837,685 | 8,411,856 | 208,681 | 217,148 | 2.4 | 2.5 |
| 8 | 12 | Chiba-ken | 6,284,480 | 6,040,814 | 142,177 | 101,489 | 2.3 | 1.6 |
| 9 | 11 | Saitama-ken | 7,344,765 | 7,055,679 | 161,439 | 127,647 | 2.2 | 1.7 |
| 10 | 14 | Kanagawa-ken | 9,237,337 | 8,876,834 | 195,535 | 164,968 | 2.1 | 1.8 |
| 11 | 26 | Kyoto-fu | 2,578,087 | 2,460,764 | 52,442 | 64,881 | 2.0 | 2.5 |
| 12 | 25 | Shiga-ken | 1,413,610 | 1,359,501 | 28,704 | 25,405 | 2.0 | 1.8 |
| 13 | 08 | Ibaraki-ken | 2,867,009 | 2,763,432 | 57,819 | 45,758 | 2.0 | 1.6 |
| 14 | 09 | Tochigi-ken | 1,933,146 | 1,869,256 | 37,408 | 26,482 | 1.9 | 1.4 |
| 15 | 00 | Japan | 126,146,099 | 121,541,155 | 2,402,460 | 2,202,484 | 1.9 | 1.7 |
| 16 | 18 | Fukui-ken | 766,863 | 746,068 | 13,796 | 6,999 | 1.8 | 0.9 |
| 17 | 19 | Yamanashi-ken | 809,974 | 786,673 | 13,993 | 9,308 | 1.7 | 1.1 |
| 18 | 34 | Hiroshima-ken | 2,799,702 | 2,713,163 | 47,733 | 38,806 | 1.7 | 1.4 |
| 19 | 28 | Hyogo-ken | 5,465,002 | 5,215,927 | 87,280 | 161,795 | 1.6 | 3.0 |
| 20 | 16 | Toyama-ken | 1,034,814 | 1,009,388 | 16,326 | 9,100 | 1.6 | 0.9 |
| 21 | 20 | Nagano-ken | 2,048,011 | 1,997,083 | 31,491 | 19,437 | 1.5 | 0.9 |
| 22 | 33 | Okayama-ken | 1,888,432 | 1,810,900 | 25,116 | 52,416 | 1.3 | 2.8 |
| 23 | 40 | Fukuoka-ken | 5,135,214 | 4,923,076 | 66,699 | 145,439 | 1.3 | 2.8 |
| 24 | 47 | Okinawa-ken | 1,467,480 | 1,424,749 | 18,157 | 24,574 | 1.2 | 1.7 |
| 25 | 32 | Shimane-ken | 671,126 | 656,197 | 8,230 | 6,699 | 1.2 | 1.0 |
| 26 | 17 | Ishikawa-ken | 1,132,526 | 1,102,692 | 13,685 | 16,149 | 1.2 | 1.4 |
| 27 | 37 | Kagawa-ken | 950,244 | 920,884 | 10,854 | 18,506 | 1.1 | 1.9 |
| 28 | 35 | Yamaguchi-ken | 1,342,059 | 1,313,593 | 14,378 | 14,088 | 1.1 | 1.0 |
| 29 | 44 | Oita-ken | 1,123,852 | 1,098,735 | 10,168 | 14,949 | 0.9 | 1.3 |
| 30 | 29 | Nara-ken | 1,324,473 | 1,302,289 | 11,505 | 10,679 | 0.9 | 0.8 |
| 31 | 04 | Miyagi-ken | 2,301,996 | 2,242,701 | 19,453 | 39,842 | 0.8 | 1.7 |
| 32 | 43 | Kumamoto-ken | 1,738,301 | 1,705,205 | 14,591 | 18,505 | 0.8 | 1.1 |
| 33 | 38 | Ehime-ken | 1,334,841 | 1,296,806 | 11,159 | 26,876 | 0.8 | 2.0 |
| 34 | 31 | Tottori-ken | 553,407 | 543,979 | 4,310 | 5,118 | 0.8 | 0.9 |
| 35 | 41 | Saga-ken | 811,442 | 796,285 | 5,940 | 9,217 | 0.7 | 1.1 |
| 36 | 07 | Fukushima-ken | 1,833,152 | 1,797,450 | 12,868 | 22,834 | 0.7 | 1.2 |
| 37 | 36 | Tokushima-ken | 719,559 | 693,084 | 5,033 | 21,442 | 0.7 | 3.0 |
| 38 | 15 | Niigata-ken | 2,201,272 | 2,168,416 | 15,028 | 17,828 | 0.7 | 0.8 |
| 39 | 06 | Yamagata-ken | 1,068,027 | 1,056,617 | 7,149 | 4,261 | 0.7 | 0.4 |
| 40 | 01 | Hokkaido | 5,224,614 | 5,151,366 | 34,321 | 38,927 | 0.7 | 0.7 |
| 41 | 30 | Wakayama-ken | 922,584 | 911,408 | 6,029 | 5,147 | 0.7 | 0.6 |
| 42 | 42 | Nagasaki-ken | 1,312,317 | 1,296,014 | 8,316 | 7,987 | 0.6 | 0.6 |
| 43 | 46 | Kagoshima-ken | 1,588,256 | 1,545,763 | 10,037 | 32,456 | 0.6 | 2.0 |
| 44 | 39 | Kochi-ken | 691,527 | 677,762 | 4,220 | 9,545 | 0.6 | 1.4 |
| 45 | 45 | Miyazaki-ken | 1,069,576 | 1,047,871 | 6,474 | 15,231 | 0.6 | 1.4 |
| 46 | 03 | Iwate-ken | 1,210,534 | 1,194,745 | 6,937 | 8,852 | 0.6 | 0.7 |
| 47 | 02 | Aomori-ken | 1,237,984 | 1,224,334 | 5,409 | 8,241 | 0.4 | 0.7 |
| 48 | 05 | Akita-ken | 959,502 | 950,192 | 3,651 | 5,659 | 0.4 | 0.6 |
Sys.time()[1] "2024-02-04 08:59:39 JST"R.Version()$version.string[1] "R version 4.3.2 Patched (2023-12-27 r85754 ucrt)"quarto::quarto_version()[1] '1.4.542'packageVersion(pkg = "tidyverse")[1] '2.0.0'