Analysis
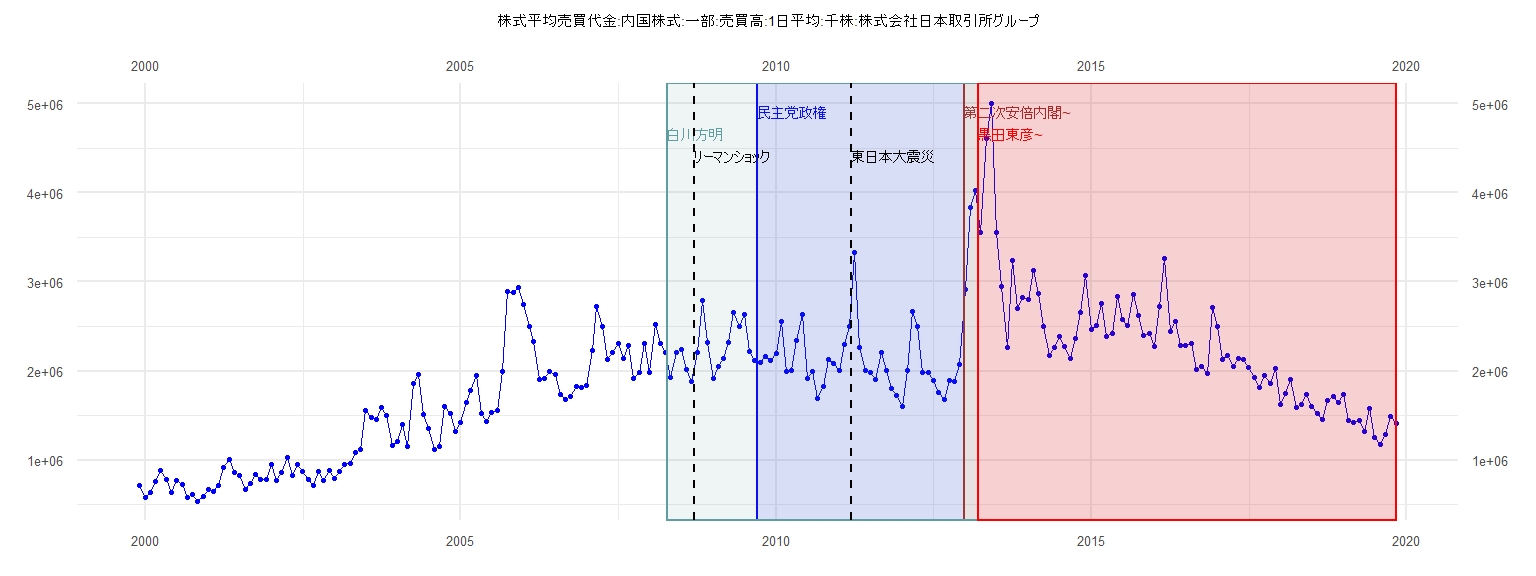
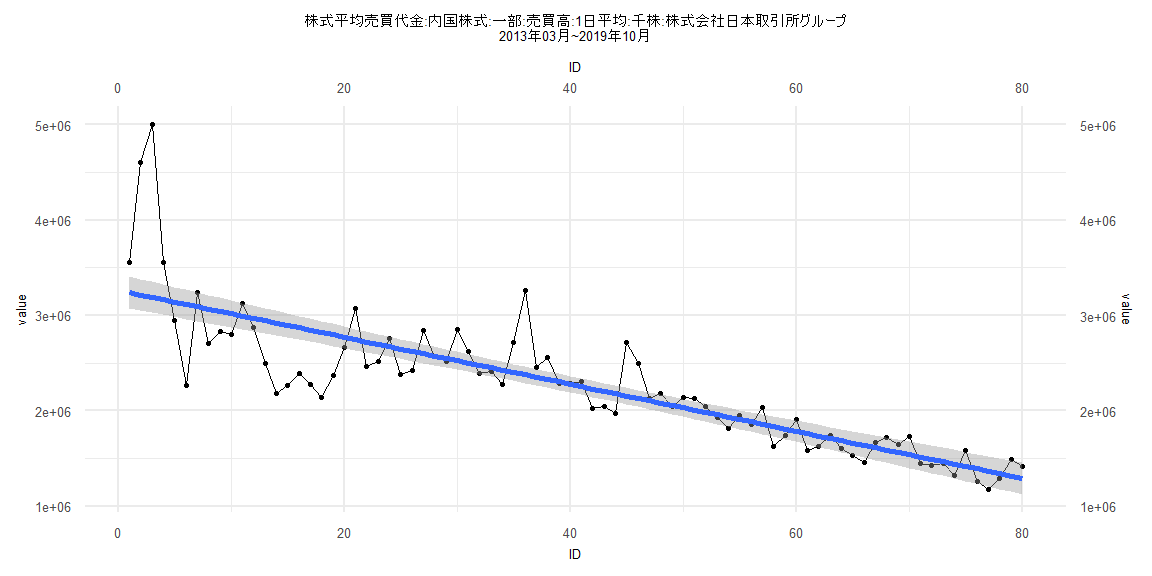
[1] "株式平均売買代金:内国株式:一部:売買高:1日平均:千株:株式会社日本取引所グループ"
         Jan     Feb     Mar     Apr     May     Jun     Jul     Aug     Sep     Oct     Nov     Dec
1999                                                                                  710047  575134
2000  640779  760956  884164  782867  638082  772488  724650  584110  613713  540631  591038  664930
2001  643060  713717  914381 1002631  865599  831731  671111  741860  842244  785110  782263  947135
2002  770595  866123 1030053  831922  952375  869736  785229  717033  871233  769961  878231  791295
2003  876588  954291  967518 1084217 1122616 1554134 1474483 1460724 1585294 1495685 1163062 1210325
2004 1400253 1157295 1857235 1965664 1508844 1352201 1120390 1147681 1600804 1521444 1316837 1427572
2005 1642360 1777869 1948391 1528437 1429062 1538790 1560193 1996007 2889275 2881085 2937613 2743604
2006 2495049 2333779 1904002 1911187 1994464 1959936 1733636 1678160 1719503 1823345 1809516 1835811
2007 2233333 2720775 2494559 2125550 2209787 2306914 2138565 2289962 1921684 1983127 2312419 1979024
2008 2516822 2313448 2205310 1931162 2204915 2246808 2020376 1886910 2209539 2786987 2322138 1912830
2009 2048002 2135880 2322765 2654527 2505244 2630834 2224594 2114530 2099786 2163290 2120117 2197887
2010 2552209 1995816 2005540 2345296 2635036 1918236 1999051 1696775 1830267 2130716 2081975 2005242
2011 2295555 2494383 3332669 2266103 2008010 1981790 1903213 2209812 2006290 1805783 1728818 1597021
2012 2008909 2664570 2503486 1985887 1984231 1894023 1754986 1680406 1891772 1887431 2075938 2912053
2013 3835182 4028693 3556539 4608741 5001761 3555081 2946044 2267401 3237545 2706080 2830574 2801852
2014 3125934 2872145 2496605 2176589 2261305 2387463 2271600 2139923 2369616 2660779 3076026 2460609
2015 2511742 2754480 2384494 2417085 2839119 2573046 2514490 2856854 2622349 2393256 2415980 2272359
2016 2718768 3262015 2448774 2561153 2287284 2286602 2308172 2021369 2048188 1974530 2715708 2497699
2017 2125206 2176423 2045278 2138583 2127126 2041270 1926999 1811030 1951912 1857900 2030074 1629542
2018 1743211 1902925 1587606 1627151 1738891 1599382 1525875 1455094 1663900 1716499 1649891 1733438
2019 1449782 1420924 1446999 1318655 1580691 1253627 1173971 1291405 1484006 1410768
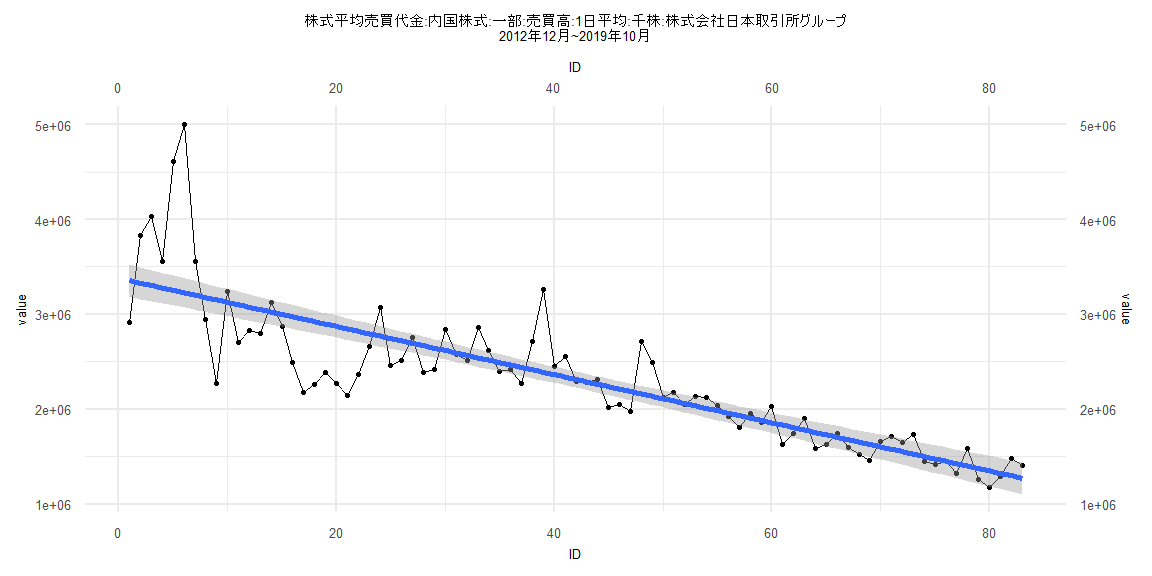
Call:
lm(formula = value ~ ID)

Residuals:
    Min      1Q  Median      3Q     Max
-457368 -177908  -77274  130811 1229528

Coefficients:
            Estimate Std. Error t value            Pr(>|t|)
(Intercept)  2241576     105376  21.272 <0.0000000000000002 ***
ID             -7286       4592  -1.587               0.121
---
Signif. codes:  0 '***' 0.001 '**' 0.01 '*' 0.05 '.' 0.1 ' ' 1

Residual standard error: 322700 on 37 degrees of freedom
Multiple R-squared:  0.06372,   Adjusted R-squared:  0.03841
F-statistic: 2.518 on 1 and 37 DF,  p-value: 0.1211


    Two-sample Kolmogorov-Smirnov test

data:  lm_residuals and rnorm(n = length(lm_residuals), mean = 0, sd = sd(lm_residuals))
D = 0.28205, p-value = 0.08974
alternative hypothesis: two-sided


    Durbin-Watson test

data:  value ~ ID
DW = 1.1987, p-value = 0.002443
alternative hypothesis: true autocorrelation is greater than 0


    studentized Breusch-Pagan test

data:  value ~ ID
BP = 0.0046442, df = 1, p-value = 0.9457


    Box-Ljung test

data:  lm_residuals
X-squared = 6.6146, df = 1, p-value = 0.01011
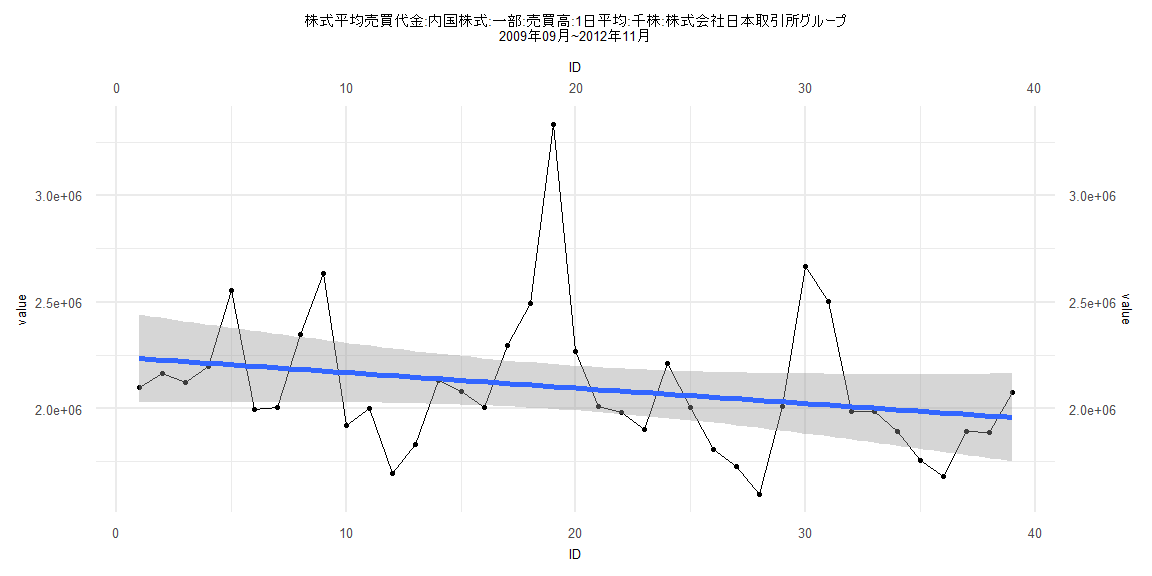
Call:
lm(formula = value ~ ID)

Residuals:
    Min      1Q  Median      3Q     Max
-882982 -172067  -24857  122006 1775174

Coefficients:
            Estimate Std. Error t value            Pr(>|t|)
(Intercept)  3378995      86699   38.97 <0.0000000000000002 ***
ID            -25401       1793  -14.17 <0.0000000000000002 ***
---
Signif. codes:  0 '***' 0.001 '**' 0.01 '*' 0.05 '.' 0.1 ' ' 1

Residual standard error: 391400 on 81 degrees of freedom
Multiple R-squared:  0.7125,    Adjusted R-squared:  0.7089
F-statistic: 200.7 on 1 and 81 DF,  p-value: < 0.00000000000000022


    Two-sample Kolmogorov-Smirnov test

data:  lm_residuals and rnorm(n = length(lm_residuals), mean = 0, sd = sd(lm_residuals))
D = 0.14458, p-value = 0.3526
alternative hypothesis: two-sided


    Durbin-Watson test

data:  value ~ ID
DW = 0.91028, p-value = 0.00000001461
alternative hypothesis: true autocorrelation is greater than 0


    studentized Breusch-Pagan test

data:  value ~ ID
BP = 12.344, df = 1, p-value = 0.0004423


    Box-Ljung test

data:  lm_residuals
X-squared = 24.738, df = 1, p-value = 0.0000006569
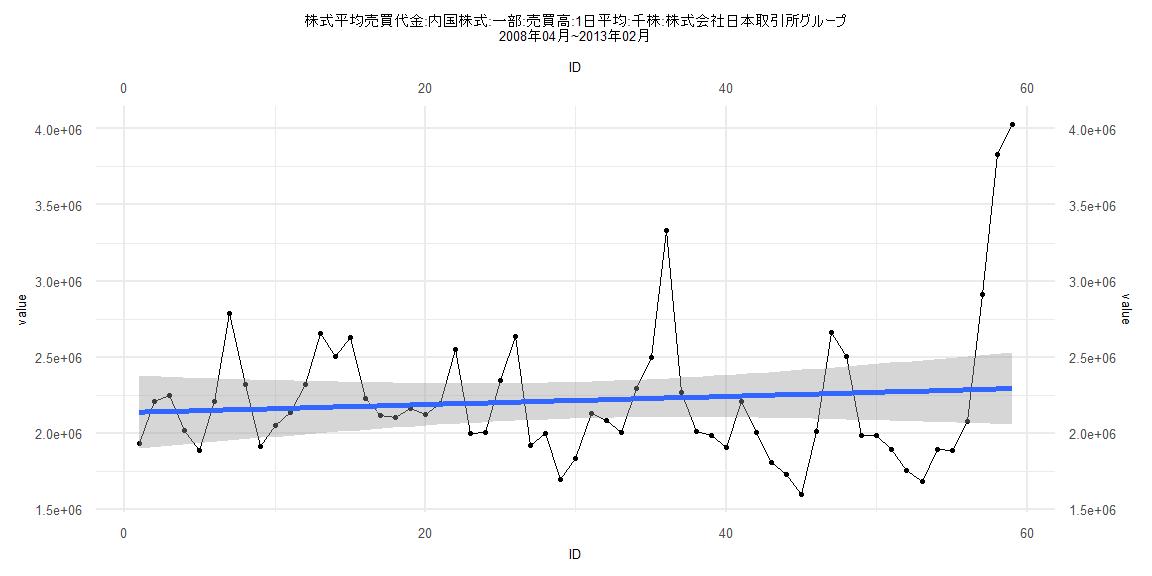
Call:
lm(formula = value ~ ID)

Residuals:
    Min      1Q  Median      3Q     Max
-657973 -258990  -86749  150073 1736170

Coefficients:
            Estimate Std. Error t value            Pr(>|t|)
(Intercept)  2134366     121560  17.558 <0.0000000000000002 ***
ID              2681       3524   0.761                0.45
---
Signif. codes:  0 '***' 0.001 '**' 0.01 '*' 0.05 '.' 0.1 ' ' 1

Residual standard error: 460900 on 57 degrees of freedom
Multiple R-squared:  0.01005,   Adjusted R-squared:  -0.007317
F-statistic: 0.5787 on 1 and 57 DF,  p-value: 0.45


    Two-sample Kolmogorov-Smirnov test

data:  lm_residuals and rnorm(n = length(lm_residuals), mean = 0, sd = sd(lm_residuals))
D = 0.13559, p-value = 0.6544
alternative hypothesis: two-sided


    Durbin-Watson test

data:  value ~ ID
DW = 0.62334, p-value = 0.0000000001134
alternative hypothesis: true autocorrelation is greater than 0


    studentized Breusch-Pagan test

data:  value ~ ID
BP = 8.6668, df = 1, p-value = 0.003241


    Box-Ljung test

data:  lm_residuals
X-squared = 19.608, df = 1, p-value = 0.000009509
Call:
lm(formula = value ~ ID)

Residuals:
    Min      1Q  Median      3Q     Max
-847475 -181173  -26474  122408 1812908

Coefficients:
            Estimate Std. Error t value            Pr(>|t|)
(Intercept)  3262829      86280   37.82 <0.0000000000000002 ***
ID            -24659       1851  -13.32 <0.0000000000000002 ***
---
Signif. codes:  0 '***' 0.001 '**' 0.01 '*' 0.05 '.' 0.1 ' ' 1

Residual standard error: 382200 on 78 degrees of freedom
Multiple R-squared:  0.6948,    Adjusted R-squared:  0.6908
F-statistic: 177.5 on 1 and 78 DF,  p-value: < 0.00000000000000022


    Two-sample Kolmogorov-Smirnov test

data:  lm_residuals and rnorm(n = length(lm_residuals), mean = 0, sd = sd(lm_residuals))
D = 0.275, p-value = 0.004533
alternative hypothesis: two-sided


    Durbin-Watson test

data:  value ~ ID
DW = 0.89033, p-value = 0.00000001286
alternative hypothesis: true autocorrelation is greater than 0


    studentized Breusch-Pagan test

data:  value ~ ID
BP = 10.954, df = 1, p-value = 0.0009339


    Box-Ljung test

data:  lm_residuals
X-squared = 25.096, df = 1, p-value = 0.0000005454