Analysis
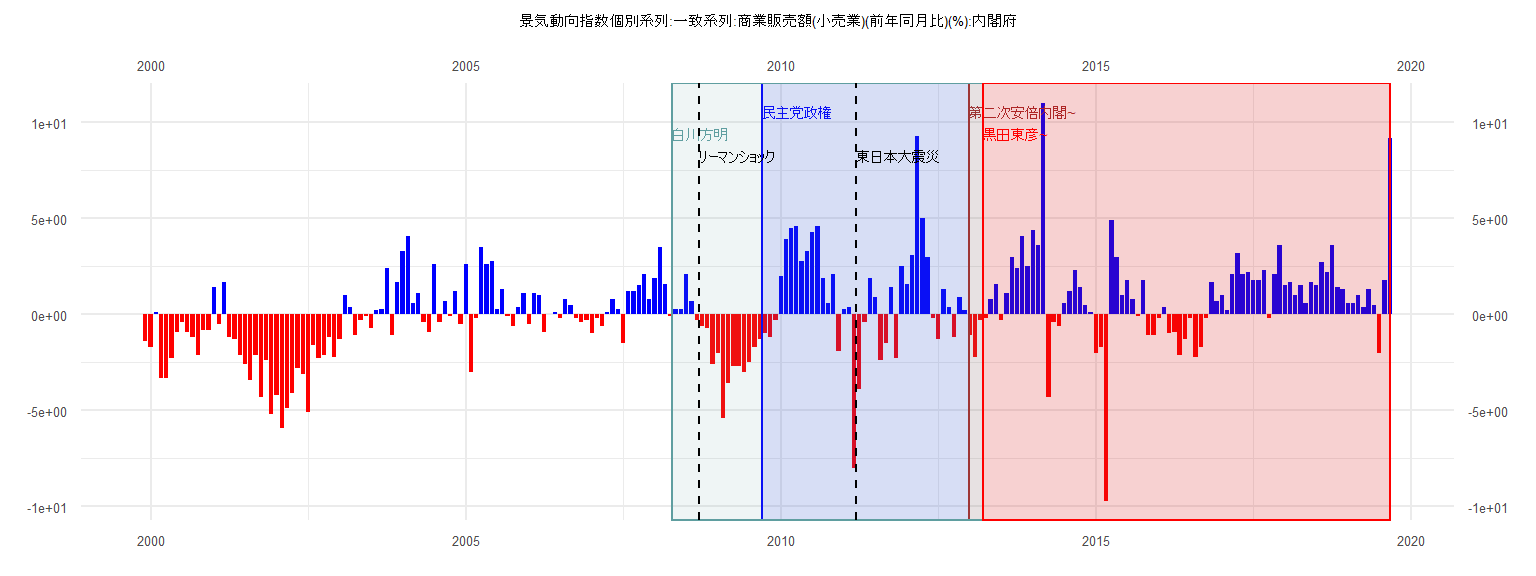
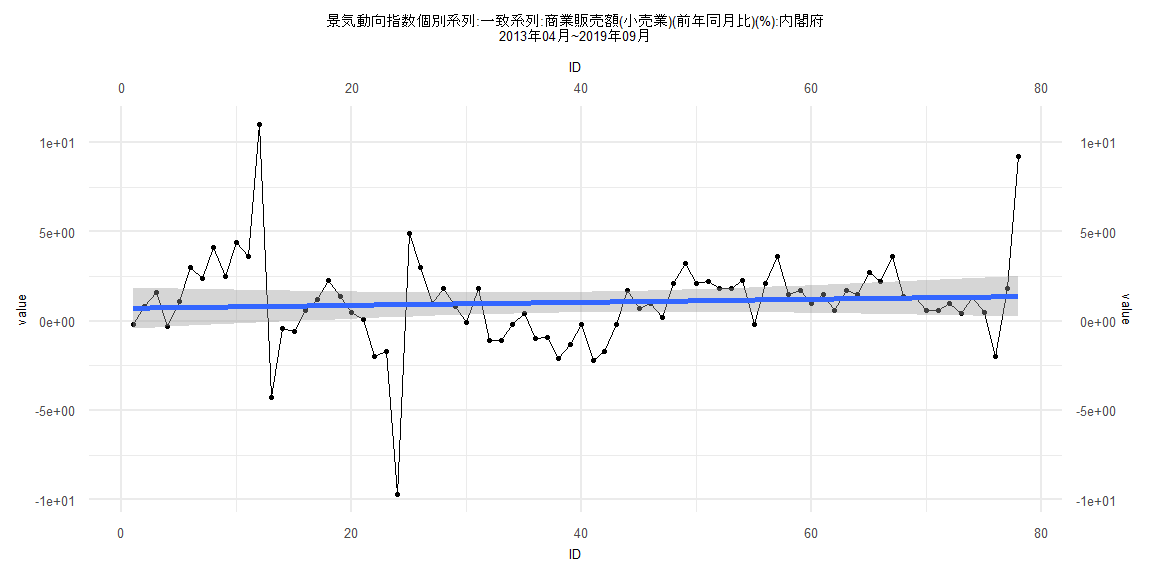
[1] "景気動向指数個別系列:一致系列:商業販売額(小売業)(前年同月比)(%):内閣府"
      Jan  Feb  Mar  Apr  May  Jun  Jul  Aug  Sep  Oct  Nov  Dec
1999                                                        -1.4
2000 -1.7  0.1 -3.3 -3.3 -2.3 -0.9 -0.4 -0.9 -1.2 -2.1 -0.8 -0.8
2001  1.4 -0.5  1.7 -1.2 -1.3 -2.1 -2.6 -3.4 -2.1 -4.3 -2.4 -5.2
2002 -4.2 -5.9 -4.9 -4.1 -2.8 -3.1 -5.1 -1.6 -2.3 -2.1 -1.2 -2.2
2003 -1.3  1.0  0.4 -1.1 -0.3 -0.1 -0.7  0.2  0.3  2.4 -1.1  1.7
2004  3.3  4.1  0.6  1.1 -0.4 -0.9  2.6 -0.4  0.7 -0.1  1.2 -0.5
2005  2.6 -3.0 -0.2  3.5  2.6  2.8  0.3  1.3 -0.1 -0.6  0.4  1.1
2006 -0.5  1.1  1.0 -0.9  0.0  0.1 -0.2  0.8  0.5 -0.2 -0.4 -0.3
2007 -1.0 -0.2 -0.6  0.1  0.8  0.3 -1.5  1.2  1.2  1.5  2.1  0.8
2008  1.9  3.5  1.6 -0.1  0.3  0.3  2.1  0.7 -0.3 -0.6 -0.7 -2.6
2009 -2.0 -5.4 -3.6 -2.7 -2.7 -3.0 -2.5 -1.7 -1.3 -1.0 -1.2 -0.3
2010  2.0  3.9  4.5  4.6  2.8  3.3  4.3  4.6  1.9  0.6  2.1 -1.9
2011  0.3  0.4 -8.0 -3.9 -0.4  1.9  0.9 -2.4 -1.5  1.4 -2.3  2.5
2012  1.6  3.1  9.3  5.0  3.0 -0.2 -1.3  1.3  0.4 -1.2  0.9  0.2
2013 -1.1 -2.2 -0.3 -0.2  0.8  1.6 -0.3  1.1  3.0  2.4  4.1  2.5
2014  4.4  3.6 11.0 -4.3 -0.4 -0.6  0.6  1.2  2.3  1.4  0.5  0.1
2015 -2.0 -1.7 -9.7  4.9  3.0  1.0  1.8  0.8 -0.1  1.8 -1.1 -1.1
2016 -0.2  0.4 -1.0 -0.9 -2.1 -1.3 -0.2 -2.2 -1.7 -0.2  1.7  0.7
2017  1.0  0.2  2.1  3.2  2.1  2.2  1.8  1.8  2.3 -0.2  2.1  3.6
2018  1.5  1.7  1.0  1.5  0.6  1.7  1.5  2.7  2.2  3.6  1.4  1.3
2019  0.6  0.6  1.0  0.4  1.3  0.5 -2.0  1.8  9.2
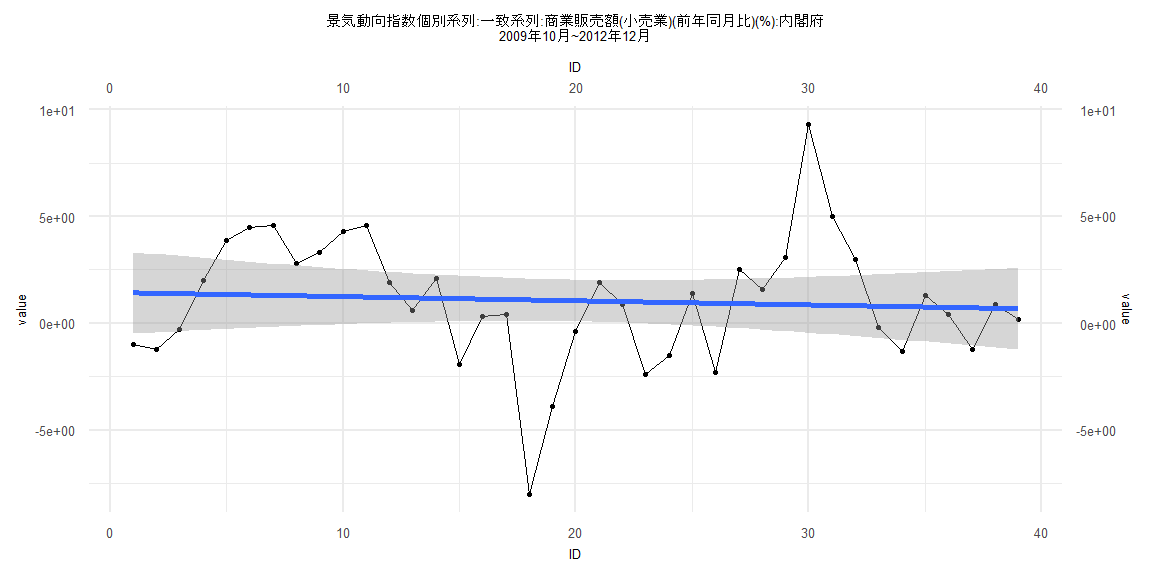
Call:
lm(formula = value ~ ID)

Residuals:
    Min      1Q  Median      3Q     Max
-9.0954 -1.8064  0.1945  1.8046  8.4385

Coefficients:
            Estimate Std. Error t value Pr(>|t|)
(Intercept)  1.44629    0.97837   1.478    0.148
ID          -0.01949    0.04263  -0.457    0.650

Residual standard error: 2.996 on 37 degrees of freedom
Multiple R-squared:  0.005619,  Adjusted R-squared:  -0.02126
F-statistic: 0.2091 on 1 and 37 DF,  p-value: 0.6502


    Two-sample Kolmogorov-Smirnov test

data:  lm_residuals and rnorm(n = length(lm_residuals), mean = 0, sd = sd(lm_residuals))
D = 0.17949, p-value = 0.5622
alternative hypothesis: two-sided


    Durbin-Watson test

data:  value ~ ID
DW = 0.90326, p-value = 0.00003831
alternative hypothesis: true autocorrelation is greater than 0


    studentized Breusch-Pagan test

data:  value ~ ID
BP = 0.0084302, df = 1, p-value = 0.9268


    Box-Ljung test

data:  lm_residuals
X-squared = 12.232, df = 1, p-value = 0.0004699
Call:
lm(formula = value ~ ID)

Residuals:
     Min       1Q   Median       3Q      Max
-10.4747  -1.0394  -0.0665   0.9711  10.3876

Coefficients:
            Estimate Std. Error t value Pr(>|t|)
(Intercept)  0.40938    0.56598   0.723    0.472
ID           0.01353    0.01199   1.128    0.263

Residual standard error: 2.523 on 79 degrees of freedom
Multiple R-squared:  0.01586,   Adjusted R-squared:  0.003406
F-statistic: 1.273 on 1 and 79 DF,  p-value: 0.2625


    Two-sample Kolmogorov-Smirnov test

data:  lm_residuals and rnorm(n = length(lm_residuals), mean = 0, sd = sd(lm_residuals))
D = 0.22222, p-value = 0.03633
alternative hypothesis: two-sided


    Durbin-Watson test

data:  value ~ ID
DW = 1.5312, p-value = 0.01181
alternative hypothesis: true autocorrelation is greater than 0


    studentized Breusch-Pagan test

data:  value ~ ID
BP = 1.1294, df = 1, p-value = 0.2879


    Box-Ljung test

data:  lm_residuals
X-squared = 2.5215, df = 1, p-value = 0.1123
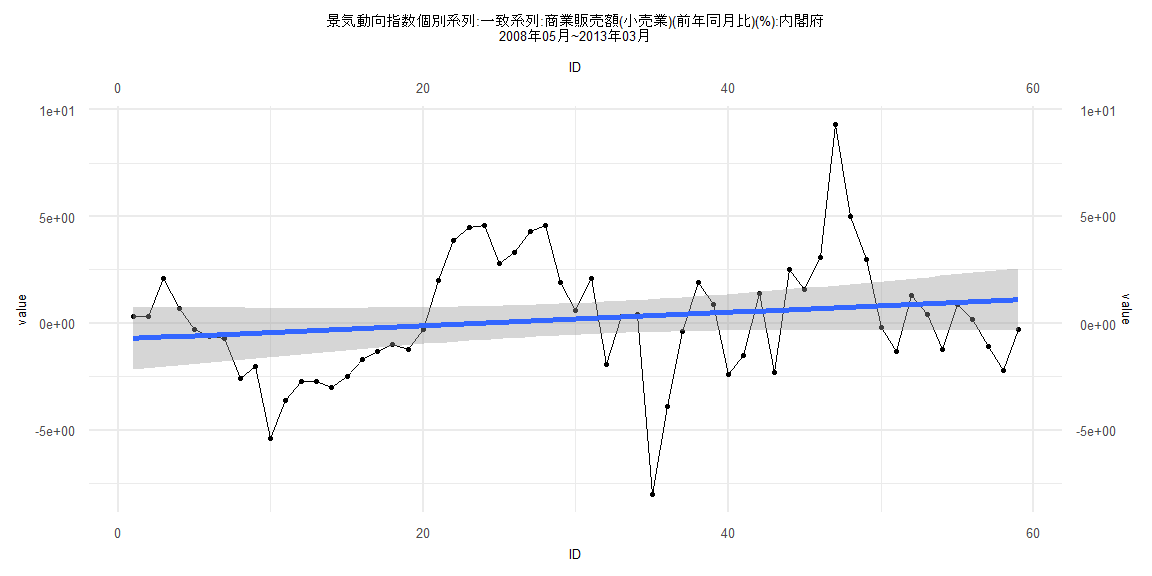
Call:
lm(formula = value ~ ID)

Residuals:
    Min      1Q  Median      3Q     Max
-8.3579 -2.1298 -0.0825  1.7953  8.5673

Coefficients:
            Estimate Std. Error t value Pr(>|t|)
(Intercept) -0.73530    0.74752  -0.984    0.329
ID           0.03123    0.02167   1.441    0.155

Residual standard error: 2.834 on 57 degrees of freedom
Multiple R-squared:  0.03516,   Adjusted R-squared:  0.01824
F-statistic: 2.077 on 1 and 57 DF,  p-value: 0.155


    Two-sample Kolmogorov-Smirnov test

data:  lm_residuals and rnorm(n = length(lm_residuals), mean = 0, sd = sd(lm_residuals))
D = 0.15254, p-value = 0.5021
alternative hypothesis: two-sided


    Durbin-Watson test

data:  value ~ ID
DW = 0.7287, p-value = 0.000000005786
alternative hypothesis: true autocorrelation is greater than 0


    studentized Breusch-Pagan test

data:  value ~ ID
BP = 0.38366, df = 1, p-value = 0.5357


    Box-Ljung test

data:  lm_residuals
X-squared = 24.815, df = 1, p-value = 0.0000006309
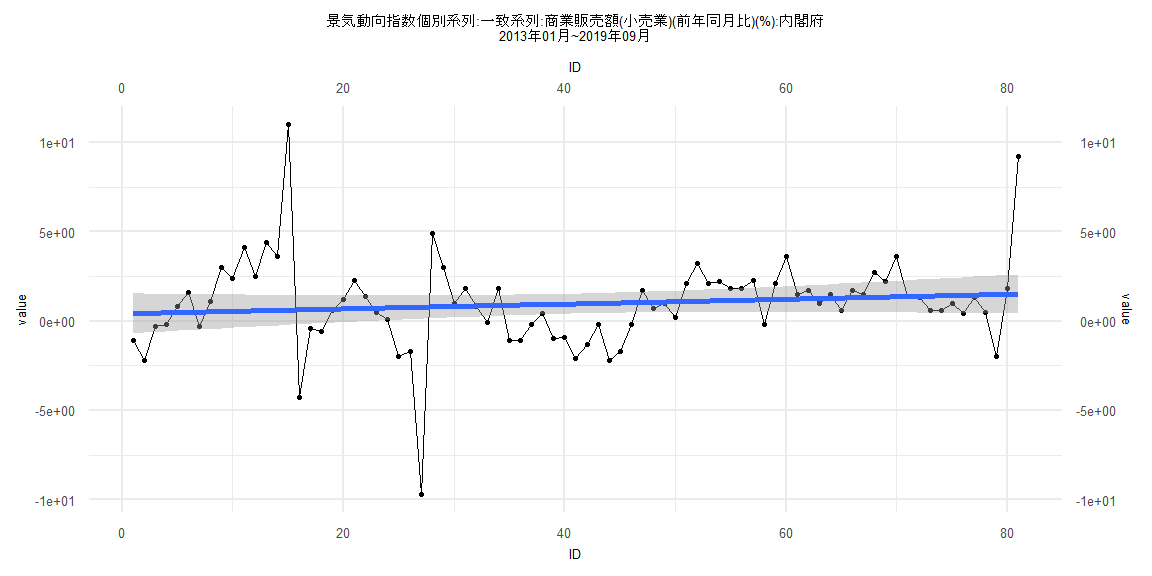
Call:
lm(formula = value ~ ID)

Residuals:
     Min       1Q   Median       3Q      Max
-10.6159  -1.0617   0.0305   0.9239  10.1859

Coefficients:
            Estimate Std. Error t value Pr(>|t|)
(Intercept) 0.712321   0.581688   1.225    0.225
ID          0.008484   0.012794   0.663    0.509

Residual standard error: 2.544 on 76 degrees of freedom
Multiple R-squared:  0.005753,  Adjusted R-squared:  -0.00733
F-statistic: 0.4397 on 1 and 76 DF,  p-value: 0.5093


    Two-sample Kolmogorov-Smirnov test

data:  lm_residuals and rnorm(n = length(lm_residuals), mean = 0, sd = sd(lm_residuals))
D = 0.15385, p-value = 0.316
alternative hypothesis: two-sided


    Durbin-Watson test

data:  value ~ ID
DW = 1.5564, p-value = 0.01744
alternative hypothesis: true autocorrelation is greater than 0


    studentized Breusch-Pagan test

data:  value ~ ID
BP = 1.2818, df = 1, p-value = 0.2576


    Box-Ljung test

data:  lm_residuals
X-squared = 2.041, df = 1, p-value = 0.1531