商品/Commodity
- 米国石油週間在庫報告、米国内掘削リグ稼働数、シェールガス、主要国の粗鋼生産量、原油生産量、エネルギー、金属、農林畜産物そして暗号資産 -
アセット・マネジメント・コンサルティング株式会社 https://am-consulting.co.jp
更新日時:2019-12-05 08:16:02
Analysis
| Date | 11-29 | 11-22 | 11-15 | 11-08 | 11-01 |
|---|---|---|---|---|---|
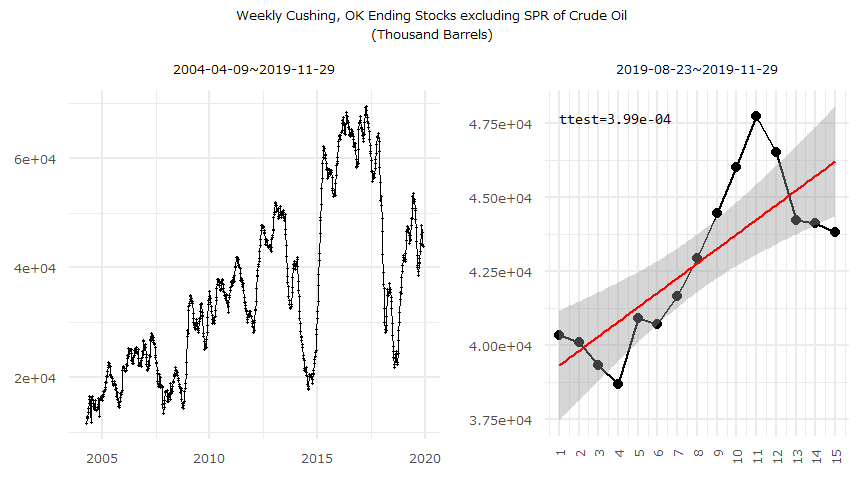
| Weekly Cushing, OK Ending Stocks excluding SPR of Crude Oil(Thousand Barrels) | 43,822 | 44,124 | 44,221 | 46,516 | 47,745 |
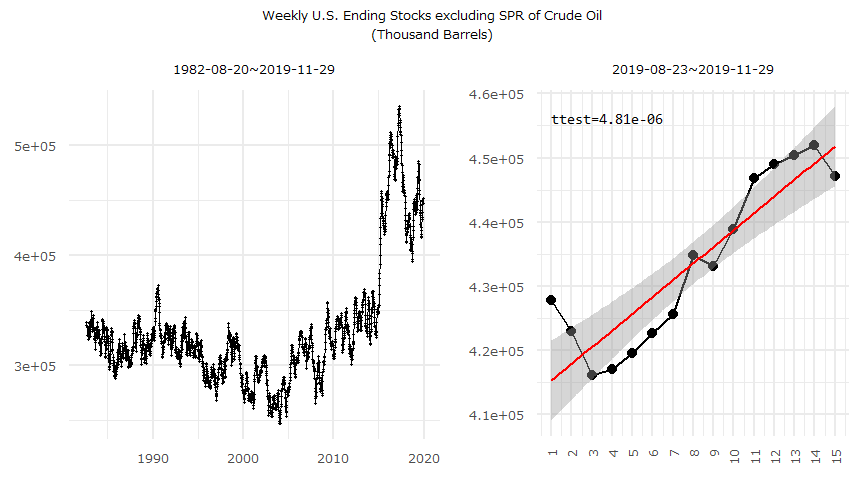
| Weekly U.S. Ending Stocks excluding SPR of Crude Oil(Thousand Barrels) | 447,096 | 451,952 | 450,380 | 449,001 | 446,782 |
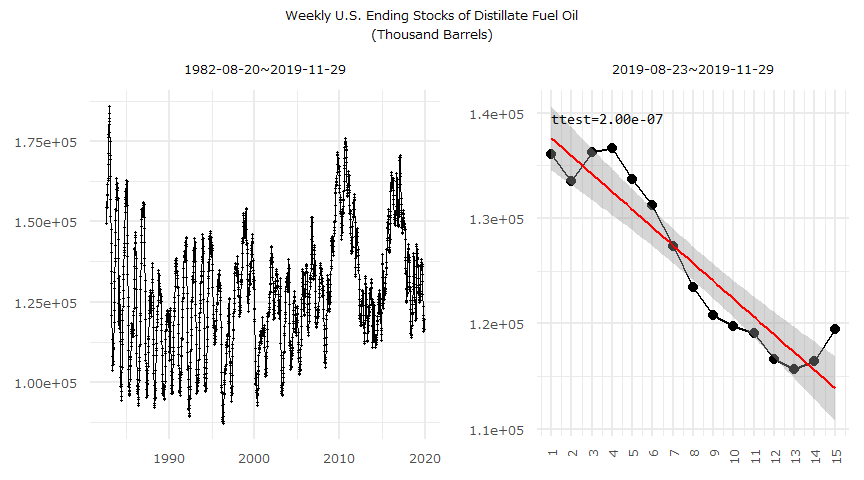
| Weekly U.S. Ending Stocks of Distillate Fuel Oil(Thousand Barrels) | 119,469 | 116,406 | 115,681 | 116,655 | 119,132 |
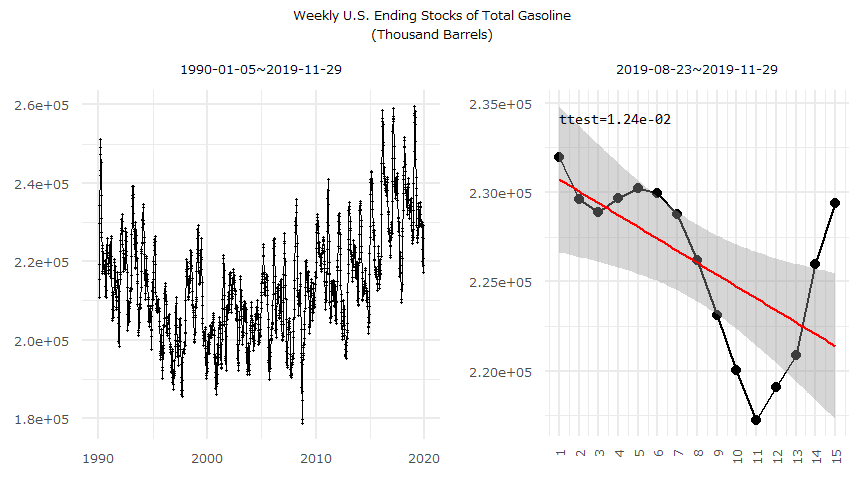
| Weekly U.S. Ending Stocks of Total Gasoline(Thousand Barrels) | 229,363 | 225,978 | 220,846 | 219,090 | 217,229 |
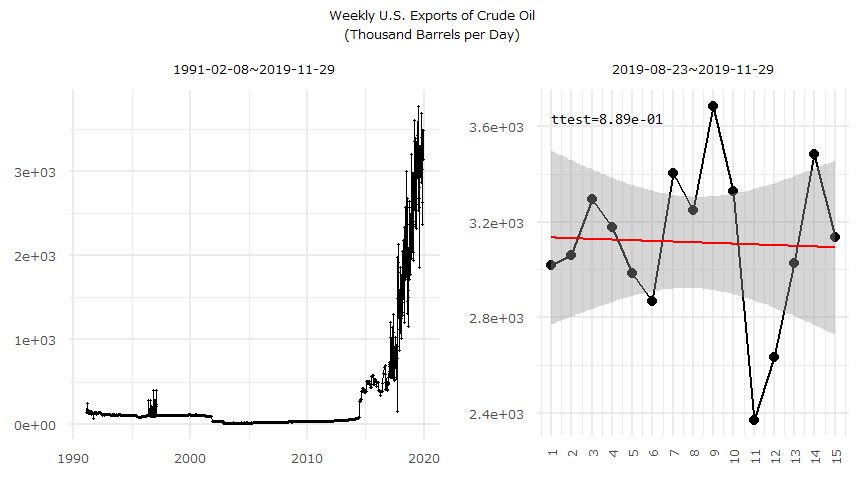
| Weekly U.S. Exports of Crude Oil(Thousand Barrels per Day) | 3,135 | 3,480 | 3,027 | 2,633 | 2,371 |
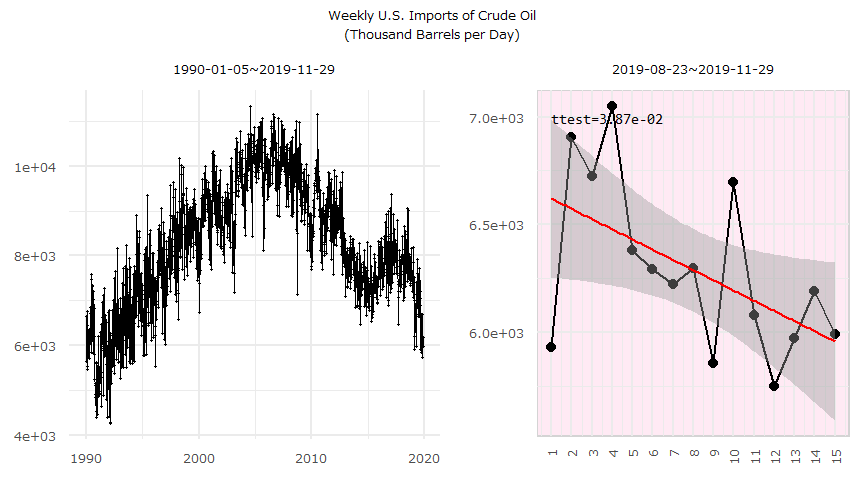
| Weekly U.S. Imports of Crude Oil(Thousand Barrels per Day) | 5,989 | 6,190 | 5,972 | 5,750 | 6,077 |
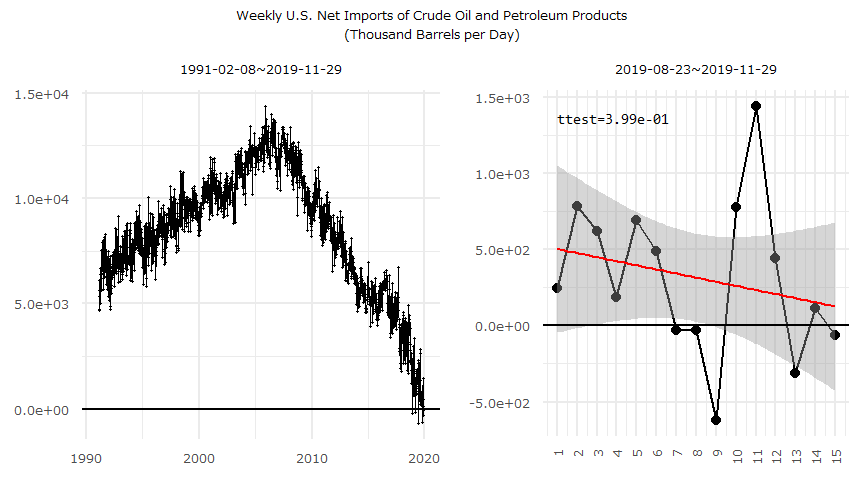
| Weekly U.S. Net Imports of Crude Oil and Petroleum Products(Thousand Barrels per Day) | -62 | 113 | -310 | 439 | 1,439 |
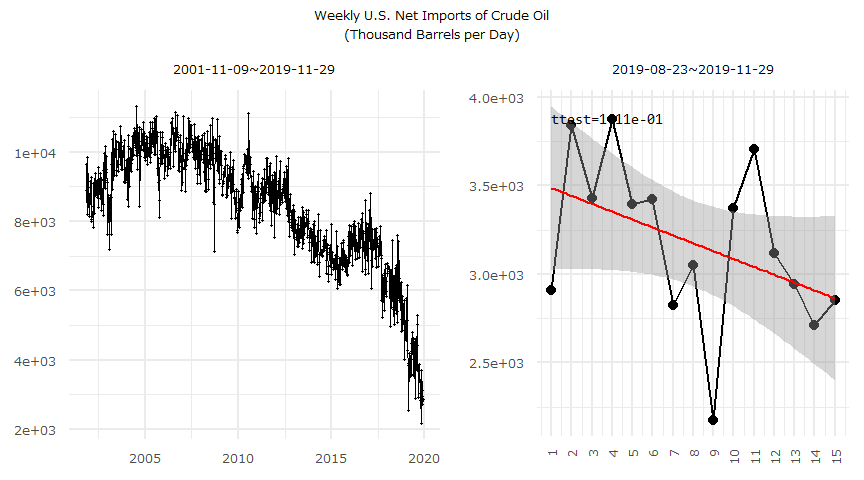
| Weekly U.S. Net Imports of Crude Oil(Thousand Barrels per Day) | 2,854 | 2,710 | 2,945 | 3,117 | 3,706 |
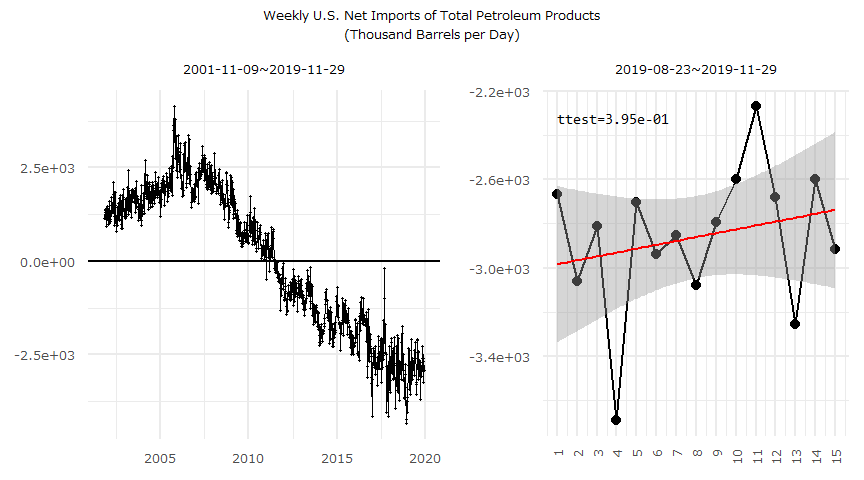
| Weekly U.S. Net Imports of Total Petroleum Products(Thousand Barrels per Day) | -2,916 | -2,597 | -3,255 | -2,678 | -2,267 |
前週差
| Date | 11-29 | 11-22 | 11-15 | 11-08 | 11-01 |
|---|---|---|---|---|---|
| Weekly Cushing, OK Ending Stocks excluding SPR of Crude Oil(Thousand Barrels) | -302 | -97 | -2,295 | -1,229 | 1,714 |
| Weekly U.S. Ending Stocks excluding SPR of Crude Oil(Thousand Barrels) | -4,856 | 1,572 | 1,379 | 2,219 | 7,929 |
| Weekly U.S. Ending Stocks of Distillate Fuel Oil(Thousand Barrels) | 3,063 | 725 | -974 | -2,477 | -622 |
| Weekly U.S. Ending Stocks of Total Gasoline(Thousand Barrels) | 3,385 | 5,132 | 1,756 | 1,861 | -2,828 |
| Weekly U.S. Exports of Crude Oil(Thousand Barrels per Day) | -345 | 453 | 394 | 262 | -956 |
| Weekly U.S. Imports of Crude Oil(Thousand Barrels per Day) | -201 | 218 | 222 | -327 | -620 |
| Weekly U.S. Net Imports of Crude Oil and Petroleum Products(Thousand Barrels per Day) | -175 | 423 | -749 | -1,000 | 666 |
| Weekly U.S. Net Imports of Crude Oil(Thousand Barrels per Day) | 144 | -235 | -172 | -589 | 336 |
| Weekly U.S. Net Imports of Total Petroleum Products(Thousand Barrels per Day) | -319 | 658 | -577 | -411 | 331 |
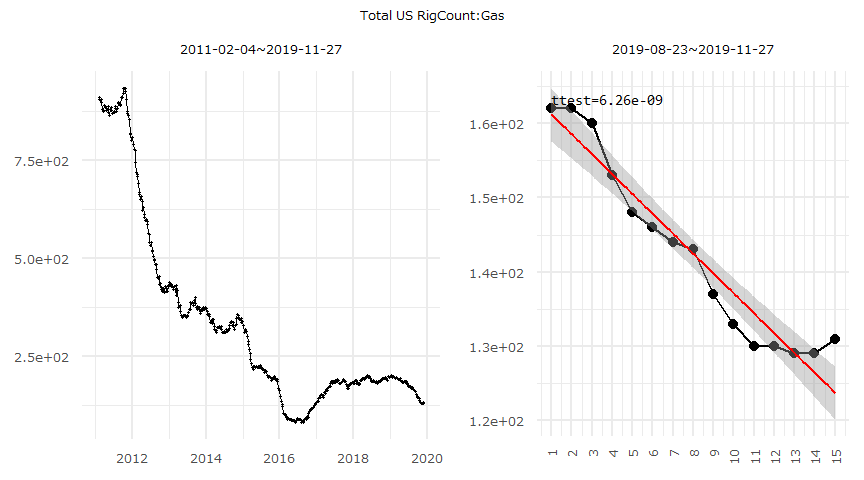
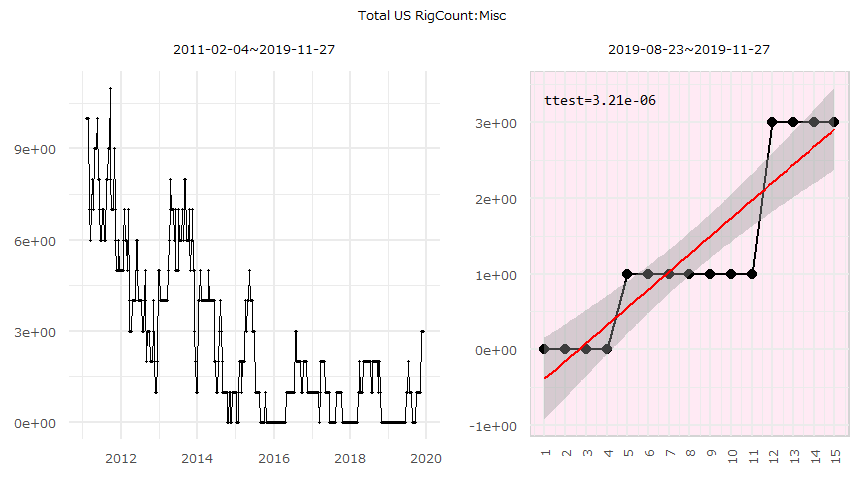
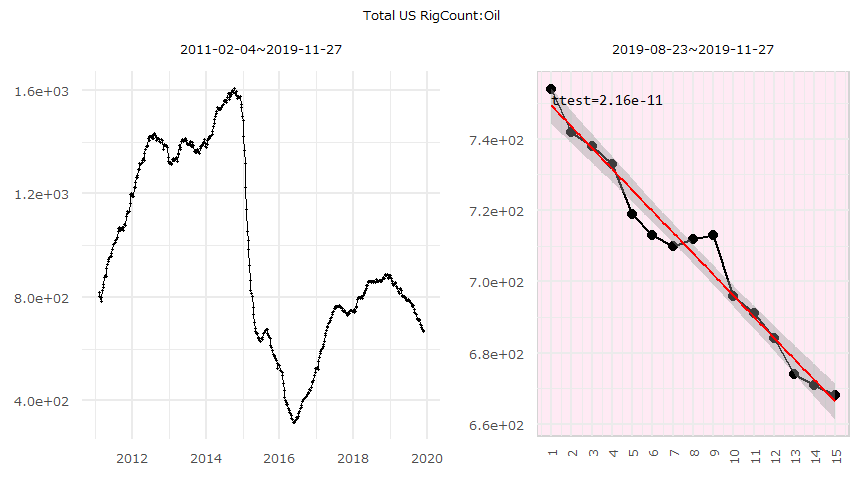
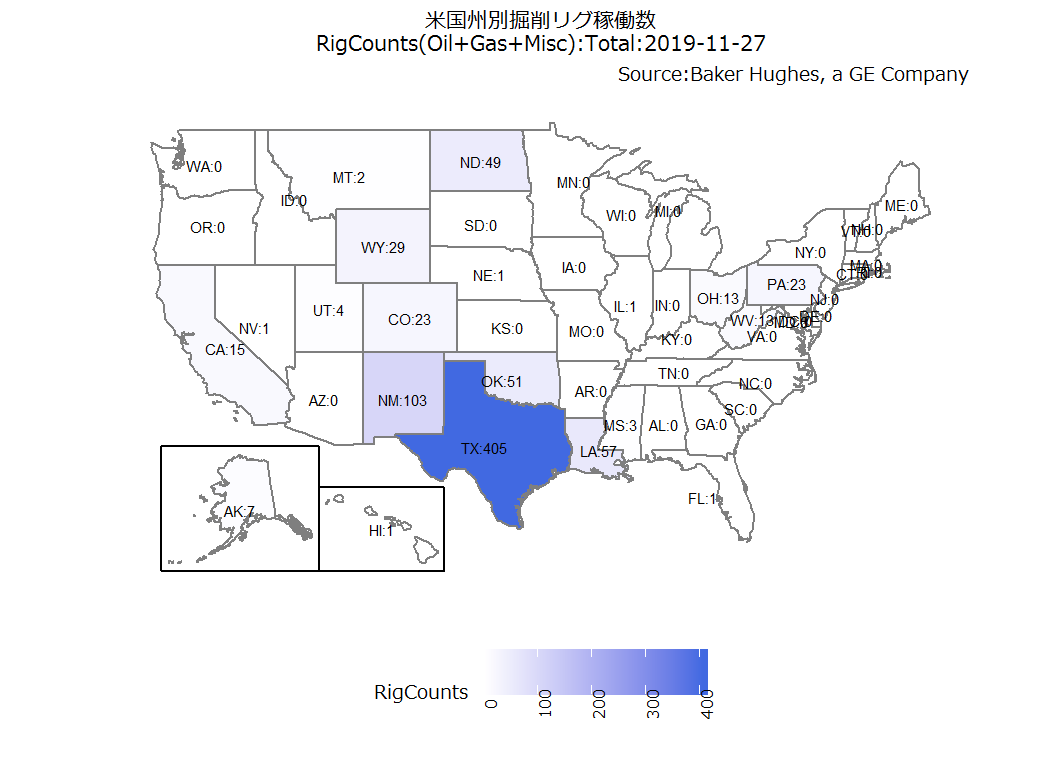
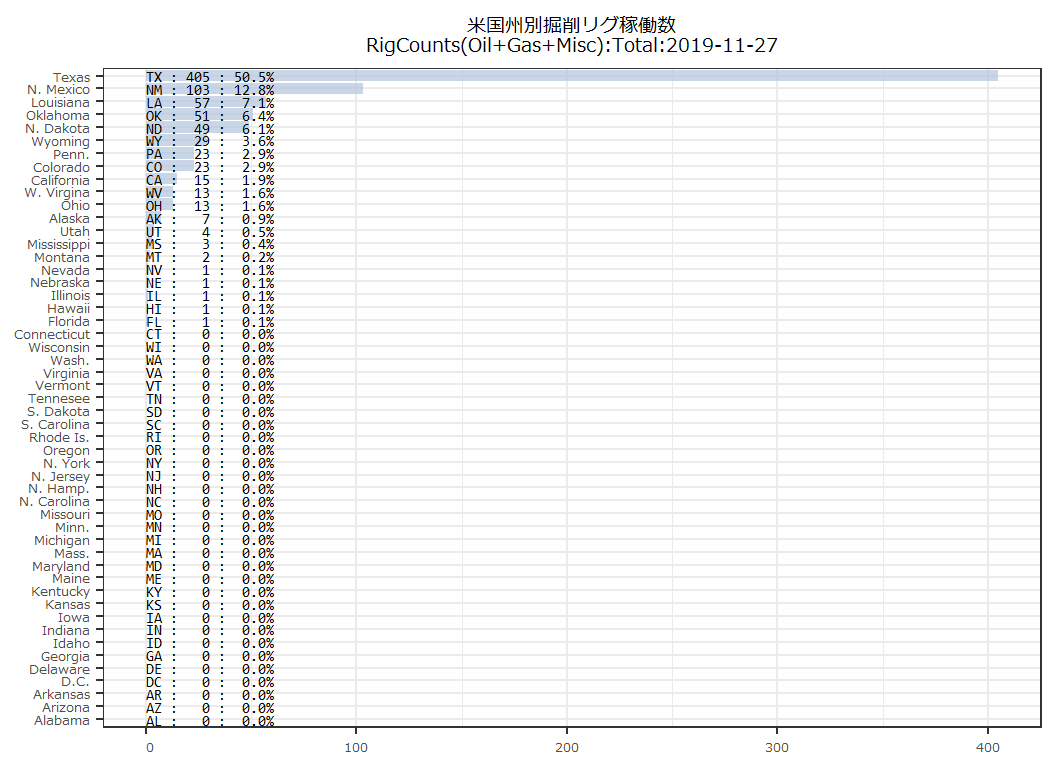
ベーカー・ヒューズ米国内掘削リグ稼働数
- Source:Baker Hughes, a GE Company
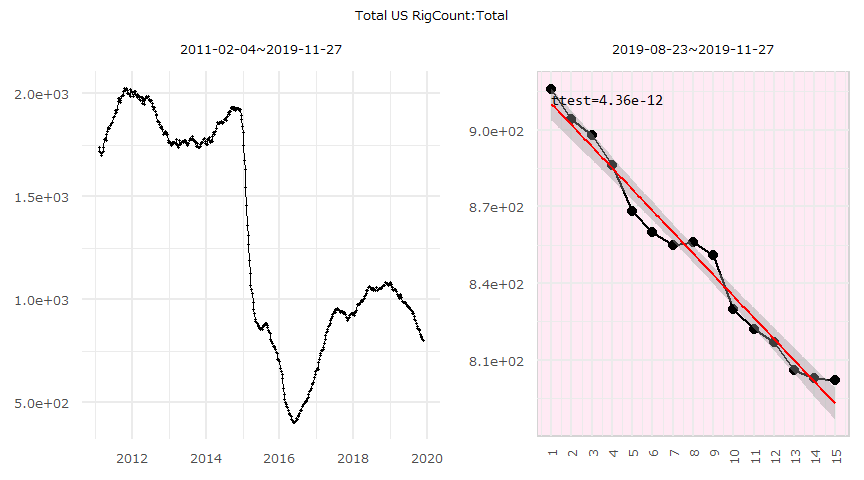
| Date | 11-27 | 11-22 | 11-15 | 11-08 | 11-01 |
|---|---|---|---|---|---|
| Total US RigCount:Gas | 131 | 129 | 129 | 130 | 130 |
| Total US RigCount:Misc | 3 | 3 | 3 | 3 | 1 |
| Total US RigCount:Oil | 668 | 671 | 674 | 684 | 691 |
| Total US RigCount:Total | 802 | 803 | 806 | 817 | 822 |
米国内シェールガス生産量
- Source:U.S. Energy Information Administration
- Shale Gas:『Natural gas produced from organic (black) shale formations.』
| Date | 2017 | 2016 | 2015 | 2014 | 2013 |
|---|---|---|---|---|---|
| U.S. Shale Production | 18589 | 17032 | 15213 | 13447 | 11415 |
| Pennsylvania Shale Production | 5365 | 5049 | 4597 | 4009 | 3076 |
| Texas (with State Offshore) Shale Production | 5171 | 5029 | 4353 | 4156 | 3876 |
| Ohio Shale Production | 1747 | 1386 | 959 | 441 | 101 |
| West Virginia Shale Production | 1486 | 1270 | 1163 | 869 | 498 |
| Louisiana (with State Offshore) Shale Production | 1450 | 1111 | 1153 | 1191 | 1510 |
| Louisiana–North Shale Production | 1414 | 1085 | 1129 | 1169 | 1509 |
| Oklahoma Shale Production | 1290 | 1082 | 993 | 869 | 698 |
| Texas–RRC District 8 Shale Production | 1115 | 730 | 109 | 78 | 62 |
| Texas–RRC District 5 Shale Production | 730 | 827 | 903 | 1022 | 1128 |
| Texas–RRC District 4 onsh Shale Production | 677 | 706 | 500 | 381 | 316 |
| North Dakota Shale Production | 664 | 582 | 545 | 426 | 268 |
| Texas–RRC District 1 Shale Production | 652 | 690 | 892 | 822 | 630 |
| Arkansas Shale Production | 618 | 733 | 923 | 1038 | 1026 |
| New Mexico Shale Production | 592 | 497 | 46 | 28 | 16 |
| Texas–RRC District 2 onsh Shale Production | 584 | 642 | 793 | 649 | 474 |
| Texas–RRC District 7C Shale Production | 494 | 451 | 140 | 111 | 13 |
| Texas–RRC District 9 Shale Production | 452 | 505 | 608 | 639 | 619 |
| Texas–RRC District 6 Shale Production | 333 | 339 | 238 | 270 | 409 |
| Texas–RRC District 7B Shale Production | 110 | 116 | 143 | 165 | 218 |
| Colorado Shale Production | 97 | 164 | 325 | 236 | 18 |
| Michigan Shale Production | 63 | 84 | 65 | 96 | 101 |
| Louisiana–South Onshore Shale Production | 36 | 26 | 24 | 22 | 1 |
| Texas–RRC District 3 onsh Shale Production | 23 | 23 | 17 | 10 | 2 |
| Montana Shale Production | 18 | 19 | 39 | 42 | 19 |
| California (with State off) Shale Production | 6 | 6 | 2 | 3 | 89 |
| Wyoming Shale Production | 6 | 5 | 36 | 29 | 102 |
| Virginia Shale Production | 4 | 4 | 3 | 3 | 3 |
| Mississippi (with State off) Shale Production | 2 | 2 | 3 | 2 | 5 |
| Texas–RRC District 8A Shale Production | 1 | 0 | 3 | 1 | 0 |
| Alaska (with Total Offshore) Shale Production | 0 | 0 | 0 | 0 | 0 |
| Kansas Shale Production | 0 | 0 | 1 | 1 | 3 |
| Texas–RRC District 10 Shale Production | 0 | 0 | 7 | 8 | 5 |
| Alabama (with State Offshore) Shale Production | *** | *** | *** | *** | *** |
| Kentucky Shale Production | *** | 0 | 1 | 2 | 4 |
| New Mexico–East Shale Production | *** | 491 | 44 | 25 | 13 |
| New Mexico–West Shale Production | *** | 6 | 2 | 3 | 3 |
| Eastern States Shale Production | *** | *** | *** | *** | *** |
| Western States Shale Production | *** | *** | *** | *** | *** |
主要国の粗鋼生産量
- Source:一般社団法人日本鉄鋼連盟
| Rank | Region/Country | 2019年09月 |
|---|---|---|
| 1 | 世界計 | 151,499 |
| 2 | 中国 | 82,773 |
| 3 | EU28カ国:計 | 13,386 |
| 4 | インド | 8,961 |
| 5 | 日本 | 8,040 |
| 6 | CIS:計 | 7,995 |
| 7 | 米国:(NT) | 7,796 |
| 8 | 米国:(MT) | 7,072 |
| 9 | 韓国 | 5,691 |
| 10 | CIS:ロシア | 5,575 |
| 11 | EU28カ国:ドイツ | 3,352 |
| 12 | トルコ | 2,733 |
| 13 | ブラジル | 2,403 |
| 14 | EU28カ国:イタリア | 2,208 |
| 15 | イラン | 2,130 |
| 16 | 台湾 | 1,830 |
| 17 | CIS:ウクライナ | 1,745 |
| 18 | メキシコ | 1,465 |
| 19 | EU28カ国:フランス | 1,205 |
| 20 | EU28カ国:スペイン | 1,175 |
| 21 | カナダ | 1,040 |
| 22 | EU28カ国:ベルギー | 670 |
| 23 | EU28カ国:ポーランド | 670 |
| 24 | EU28カ国:英国 | 599 |
| 25 | エジプト | 497 |
| 26 | 南アフリカ | 481 |
| 27 | オーストラリア | 459 |
| 28 | サウジアラビア | 425 |
| 29 | アルゼンチン | 406 |
| 30 | EU28カ国:スウェーデン | 398 |
| 31 | EU28カ国:オランダ | 396 |
| 32 | EU28カ国:チェコ | 374 |
| 33 | CIS:カザフスタン | 360 |
| 34 | EU28カ国:フィンランド | 299 |
| 35 | EU28カ国:ルクセンブルク | 183 |
| 36 | EU28カ国:ハンガリー | 109 |
| 37 | ベネズエラ | 10 |
| 38 | EU28カ国:オーストリア | 0 |
| 39 | EU28カ国:ルーマニア | 0 |
| 40 | EU28カ国:スロバキア | 0 |
各国の原油生産量
- Source:Joint Organisations Data Initiative (JODI)
- Unit:Thousand Barrels per day
| Rank | Country | ISO | 2019年09月 |
|---|---|---|---|
| 1 | United States | US | 12,450 |
| 2 | Russian Federation | RU | 10,764.2825 |
| 3 | Saudi Arabia | SA | 9,129 |
| 4 | Canada | CA | 3,731.446 |
| 5 | Mexico | MX | 1,744.512 |
| 6 | Norway | NO | 1,325.4803 |
| 7 | Malaysia | MY | 569.7467 |
| 8 | Australia | AU | 362.4472 |
| 9 | Thailand | TH | 226.6113 |
| 10 | Gabon | GA | 216 |
| 11 | Equatorial Guinea | GQ | 109 |
| 12 | Brunei Darussalam | BN | 107.529 |
| 13 | Denmark | DK | 88.06 |
| 14 | Italy | IT | 71.032 |
| 15 | Turkey | TR | 60.9267 |
| 16 | Germany | DE | 39.12 |
| 17 | Hungary | HU | 16.6147 |
| 18 | France | FR | 15.1487 |
| 19 | Poland | PL | 15.1487 |
| 20 | Austria | AT | 12.6774 |
| 21 | Chile | CL | 3.262 |
| 22 | Greece | GR | 2.892 |
| 23 | Spain | ES | 1.24 |
| 24 | Czech Republic | CZ | 1.2217 |
| 25 | Jamaica | JM | 0.9 |
| 26 | Korea, Republic of | KR | 0.2457 |
| 27 | Taiwan, Province of China | TW | 0.056 |
| 28 | Belgium | BE | 0 |
| 29 | Switzerland | CH | 0 |
| 30 | Estonia | EE | 0 |
| 31 | Finland | FI | 0 |
| 32 | Ireland | IE | 0 |
| 33 | Iceland | IS | 0 |
| 34 | Luxembourg | LU | 0 |
| 35 | Latvia | LV | 0 |
| 36 | Portugal | PT | 0 |
| 37 | Sweden | SE | 0 |
| 38 | Slovenia | SI | 0 |
| 39 | Slovakia | SK | 0 |
月次時系列データ
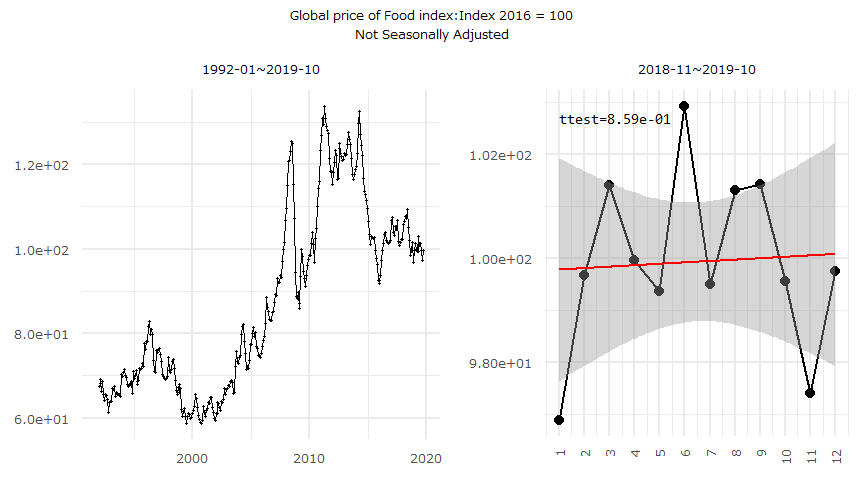
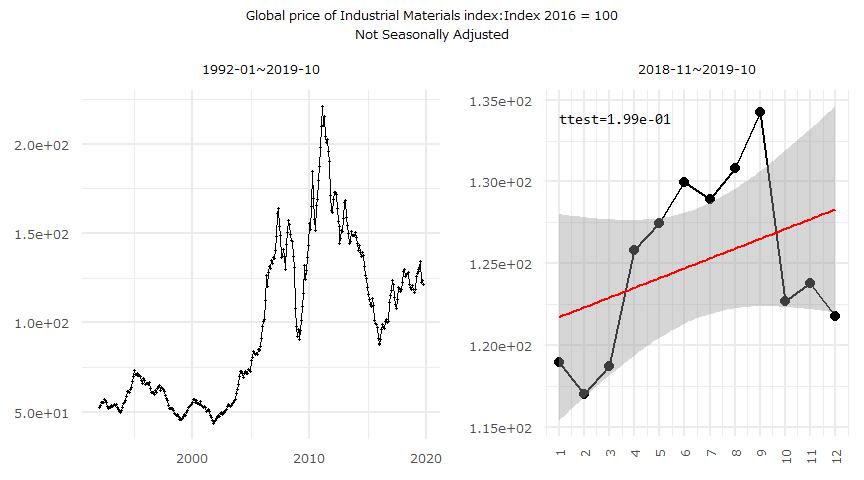
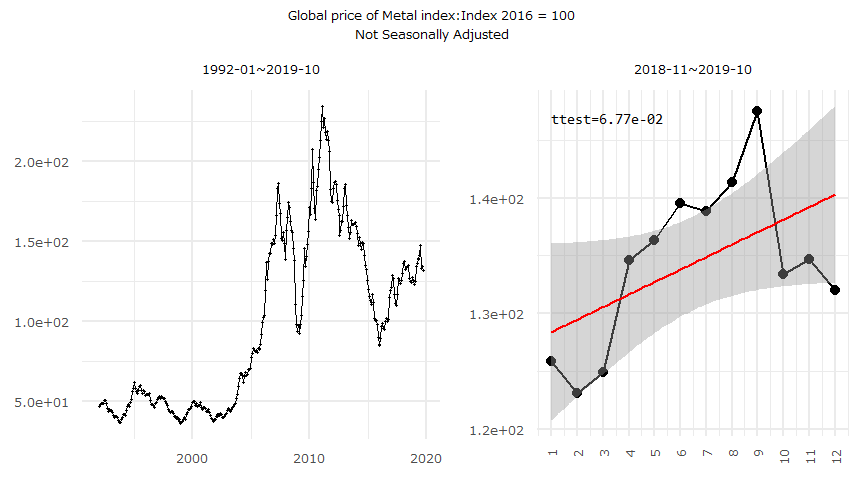
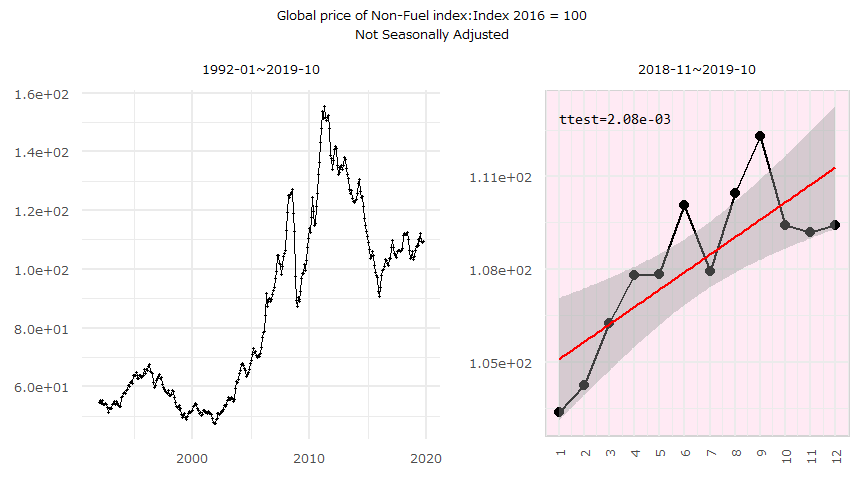
商品価格インデックス
- 世界市場を代表する月次商品価格インデックス
- Source:FRED
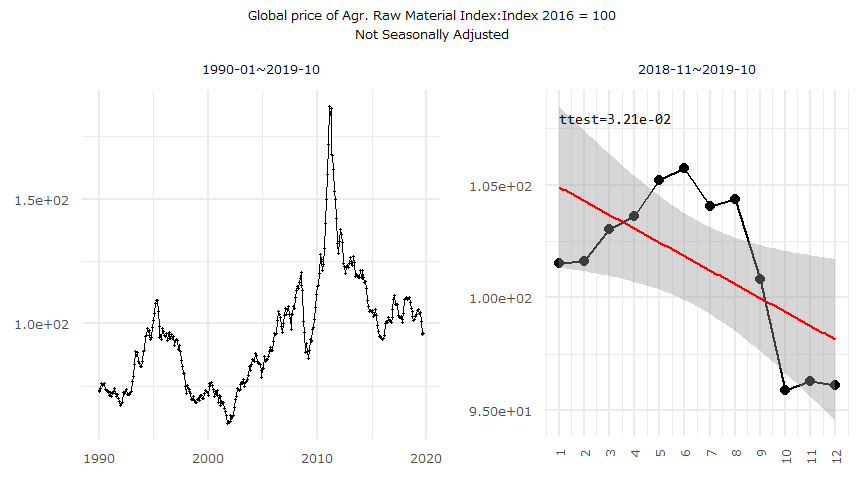
| Date | 2019-10 | 2019-09 | 2019-08 | 2019-07 | 2019-06 |
|---|---|---|---|---|---|
| Global price of Agr. Raw Material Index:Index 2016 = 100,Not Seasonally Adjusted | 96.08924 | 96.28557 | 95.90645 | 100.80438 | 104.37517 |
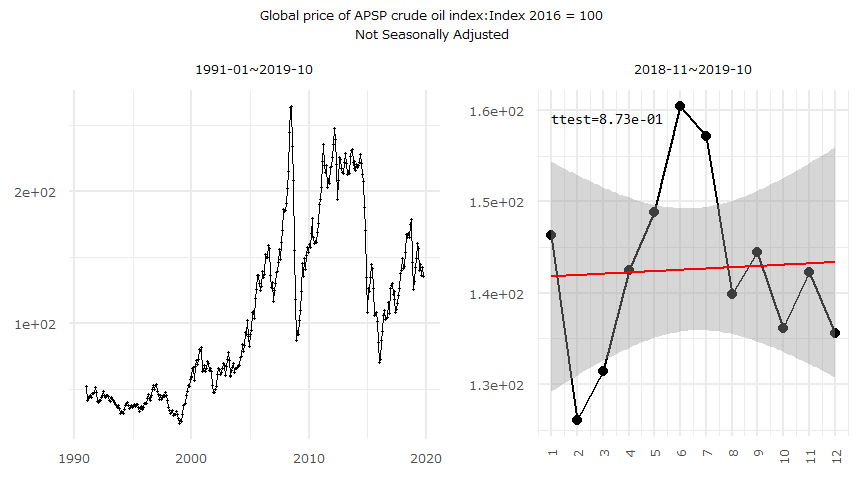
| Global price of APSP crude oil index:Index 2016 = 100,Not Seasonally Adjusted | 135.546 | 142.3262 | 136.1707 | 144.4467 | 139.917 |
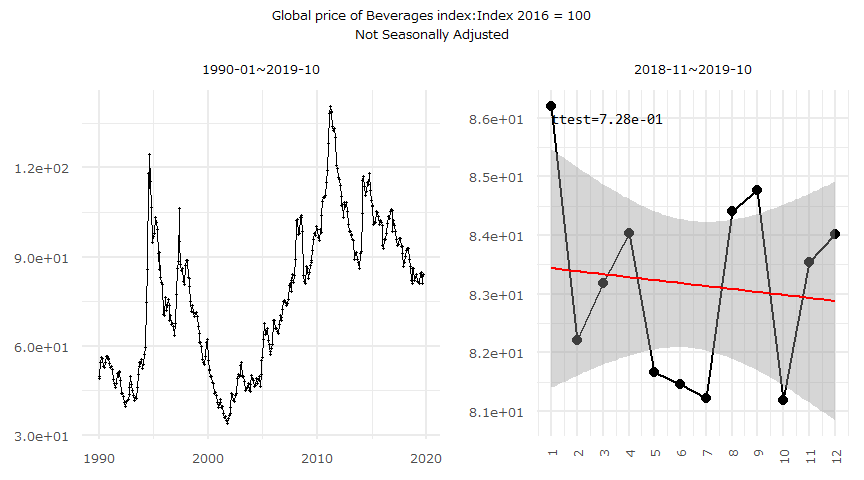
| Global price of Beverages index:Index 2016 = 100,Not Seasonally Adjusted | 84.01439 | 83.54285 | 81.18899 | 84.76585 | 84.41444 |
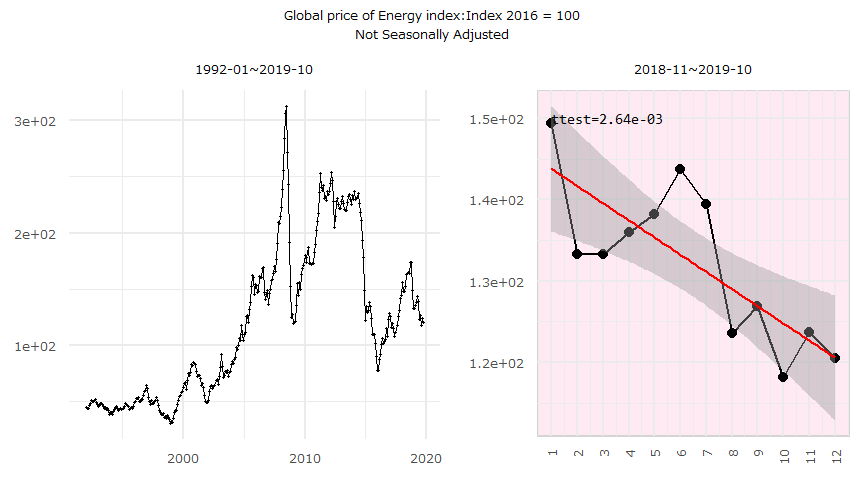
| Global price of Energy index:Index 2016 = 100,Not Seasonally Adjusted | 120.5054 | 123.7425 | 118.1801 | 126.8898 | 123.5323 |
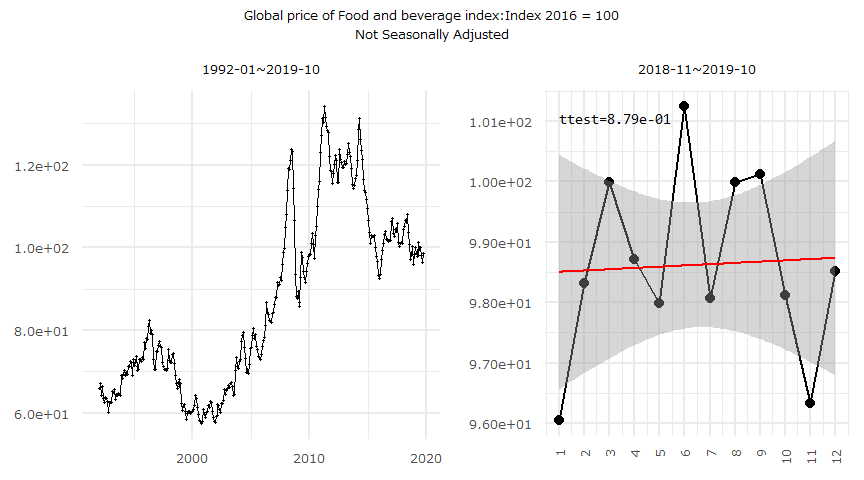
| Global price of Food and beverage index:Index 2016 = 100,Not Seasonally Adjusted | 98.51831 | 96.32791 | 98.12232 | 100.11912 | 99.98876 |
| Global price of Food index:Index 2016 = 100,Not Seasonally Adjusted | 99.74548 | 97.40965 | 99.55505 | 101.41816 | 101.3065 |
| Global price of Industrial Materials index:Index 2016 = 100,Not Seasonally Adjusted | 121.7844 | 123.7963 | 122.7108 | 134.2384 | 130.8232 |
| Global price of Metal index:Index 2016 = 100,Not Seasonally Adjusted | 131.9976 | 134.7311 | 133.3649 | 147.5277 | 141.3356 |
| Global price of Non-Fuel index:Index 2016 = 100,Not Seasonally Adjusted | 109.4198 | 109.188 | 109.4099 | 112.2855 | 110.4645 |
商品価格
- 各種商品価格
- Source:The World Bank Group
| Date | 2019-11 | 2019-10 | 2019-09 | 2019-08 | 2019-07 |
|---|---|---|---|---|---|
| Aluminum(USD/mt) | 1,774.79 | 1,725.96 | 1,753.51 | 1,740.68 | 1,796.99 |
| Banana, Europe(USD/kg) | 0.85 | 0.86 | 0.85 | 0.83 | 0.86 |
| Banana, US(USD/kg) | 1.13 | 1.13 | 1.15 | 1.12 | 1.13 |
| Barley(USD/mt) | 114.82 | 114.82 | 114.82 | 135.03 | 149.27 |
| Beef(USD/kg) | 5.94 | 4.86 | 4.65 | 4.6 | 4.63 |
| Coal, Australian(USD/mt) | 66.99 | 68.92 | 65.95 | 65.55 | 72.08 |
| Coal, South African(USD/mt) | 73.62 | 67.44 | 61.37 | 60.43 | 65.79 |
| Cocoa(USD/kg) | 2.52 | 2.44 | 2.31 | 2.19 | 2.42 |
| Coconut oil(USD/mt) | 836.29 | 719.52 | 724.03 | 719.28 | 657.31 |
| Coffee, Arabica(USD/kg) | 3.11 | 2.8 | 2.84 | 2.78 | 2.99 |
| Coffee, Robusta(USD/kg) | 1.62 | 1.51 | 1.56 | 1.56 | 1.63 |
| Copper(USD/mt) | 5,859.95 | 5,757.3 | 5,759.25 | 5,709.44 | 5,941.2 |
| Cotton, A Index(USD/kg) | 1.65 | 1.63 | 1.57 | 1.56 | 1.67 |
| Crude oil, average(USD/bbl) | 60.4 | 57.27 | 60.04 | 57.67 | 61.48 |
| Crude oil, Brent(USD/bbl) | 62.74 | 59.37 | 62.33 | 59.25 | 64 |
| Crude oil, Dubai(USD/bbl) | 61.41 | 58.47 | 60.84 | 58.92 | 62.91 |
| Crude oil, WTI(USD/bbl) | 57.06 | 53.98 | 56.95 | 54.84 | 57.52 |
| DAP(USD/mt) | 248 | 277.38 | 285.75 | 292.9 | 307.5 |
| Fish meal(USD/mt) | 1,360.93 | 1,360.05 | 1,385.38 | 1,436.95 | 1,496.12 |
| Gold(USD/troy oz) | 1,470.79 | 1,494.81 | 1,510.58 | 1,500.41 | 1,412.89 |
| Groundnut oil(USD/mt) | 1,388.47 | 1,458.53 | 1,458.25 | 1,457.89 | 1,437.71 |
| Groundnuts(USD/mt) | 1,400 | 1,358.7 | 1,321.43 | 1,252.38 | 1,260 |
| Iron ore, cfr spot(USD/dmtu) | 84.98 | 88.53 | 93.08 | 93.07 | 120.24 |
| Lead(USD/mt) | 2,021.15 | 2,184.09 | 2,071.85 | 2,044.55 | 1,975.64 |
| Liquefied natural gas, Japan(USD/mmbtu) | 9.98 | 9.98 | 10.14 | 10.86 | 10.13 |
| Logs, Cameroon(USD/cubic meter) | 386.89 | 386.86 | 385.28 | 389.41 | 392.7 |
| Logs, Malaysian(USD/cubic meter) | 273.4 | 275.34 | 277.06 | 280.19 | 275.11 |
| Maize(USD/mt) | 166.33 | 167.15 | 157.26 | 163.59 | 189.42 |
| Meat, chicken(USD/kg) | 1.85 | 1.85 | 1.85 | 1.9 | 1.99 |
| Natural gas index(2010=100) | 63.43 | 59.12 | 58.19 | 51.85 | 52.73 |
| Natural gas, Europe(USD/mmbtu) | 5.15 | 5.06 | 4.21 | 3.68 | 3.62 |
| Natural gas, US(USD/mmbtu) | 2.65 | 2.33 | 2.58 | 2.22 | 2.36 |
| Nickel(USD/mt) | 15,171.81 | 17,046.22 | 17,656.88 | 15,748.64 | 13,546.3 |
| Orange(USD/kg) | 0.53 | 0.52 | 0.53 | 0.53 | 0.54 |
| Palm kernel oil(USD/mt) | 755.76 | 593.74 | 613.15 | 619.33 | 555.03 |
| Palm oil(USD/mt) | 683.38 | 591.35 | 580.3 | 586.12 | 543.88 |
| Phosphate rock(USD/mt) | 74 | 77.5 | 77.5 | 78 | 80 |
| Platinum(USD/troy oz) | 901.8 | 897.26 | 944.7 | 859.14 | 843.95 |
| Plywood(cents/sheet) | 501.47 | 505.04 | 508.19 | 513.93 | 504.62 |
| Potassium chloride(USD/mt) | 265.5 | 265.5 | 265.5 | 265.5 | 265.5 |
| Rapeseed oil(USD/mt) | 910.73 | 908.67 | 903.07 | 877.48 | 845.27 |
| Rice, Thai 25% (USD/mt) | 415 | 418 | 421 | 421 | 409 |
| Rice, Thai 5% (USD/mt) | 421 | 424 | 427 | 430 | 416 |
| Rice, Thai A.1(USD/mt) | 394.76 | 397.04 | 401.71 | 407.52 | 391.7 |
| Rice, Viet Namese 5%(USD/mt) | 328.24 | 325.79 | 350.85 | 362.39 | 360.16 |
| Rubber, SGP/MYS(USD/kg) | 1.54 | 1.43 | 1.5 | 1.5 | 1.67 |
| Rubber, TSR20(USD/kg) | 1.39 | 1.3 | 1.34 | 1.31 | 1.41 |
| Sawnwood, Cameroon(USD/cubic meter) | 617.53 | 605.36 | 591.61 | 581.98 | 597.74 |
| Sawnwood, Malaysian(USD/cubic meter) | 702.4 | 688.55 | 672.91 | 661.96 | 679.89 |
| Shrimps, Mexican(USD/kg) | 13.68 | 13.4 | 13.23 | 13.06 | 12.95 |
| Silver(USD/troy oz) | 17.17 | 17.65 | 18.16 | 17.22 | 15.79 |
| Sorghum(USD/mt) | 161.93 | 163.8 | 149.69 | 147.93 | 159.5 |
| Soybean meal(USD/mt) | 347.29 | 341.76 | 333.13 | 337.36 | 348.73 |
| Soybean oil(USD/mt) | 774.91 | 770.8 | 779.25 | 793.21 | 748.17 |
| Soybeans(USD/mt) | 375.59 | 381.65 | 366.07 | 360.93 | 369.58 |
| Sugar, EU(USD/kg) | 0.36 | 0.36 | 0.36 | 0.36 | 0.37 |
| Sugar, US(USD/kg) | 0.6 | 0.57 | 0.57 | 0.57 | 0.57 |
| Sugar, world(USD/kg) | 0.28 | 0.28 | 0.26 | 0.27 | 0.28 |
| Sunflower oil(USD/mt) | 776 | 776 | 776 | 776 | 753.83 |
| Tea, avg 3 auctions(USD/kg) | 2.61 | 2.59 | 2.54 | 2.63 | 2.64 |
| Tea, Colombo(USD/kg) | 3.2 | 2.96 | 2.88 | 3.06 | 2.84 |
| Tea, Kolkata(USD/kg) | 2.36 | 2.46 | 2.53 | 2.71 | 2.9 |
| Tea, Mombasa(USD/kg) | 2.26 | 2.34 | 2.21 | 2.13 | 2.17 |
| Tin(USD/mt) | 16,335.48 | 16,603.39 | 16,830.62 | 16,608.99 | 17,977.85 |
| Tobacco, US import u.v.(USD/mt) | 4,810.26 | 4,835.44 | 4,844.76 | 4,522.48 | 4,541.98 |
| TSP(USD/mt) | 264 | 270 | 270 | 275 | 284 |
| Urea (USD/mt) | 224.5 | 237 | 237.75 | 262.5 | 263.5 |
| Wheat, US HRW(USD/mt) | 203.19 | 199.52 | 189.6 | 181.15 | 196.21 |
| Wheat, US SRW(USD/mt) | 223.54 | 212.85 | 201.91 | 197.52 | 203.96 |
| Woodpulp(USD/mt) | 875 | 875 | 875 | 875 | 875 |
| Zinc(USD/mt) | 2,425.48 | 2,451.65 | 2,331.56 | 2,273.01 | 2,446.51 |
日次時系列データ
Gold & Silver
- Source:FRED
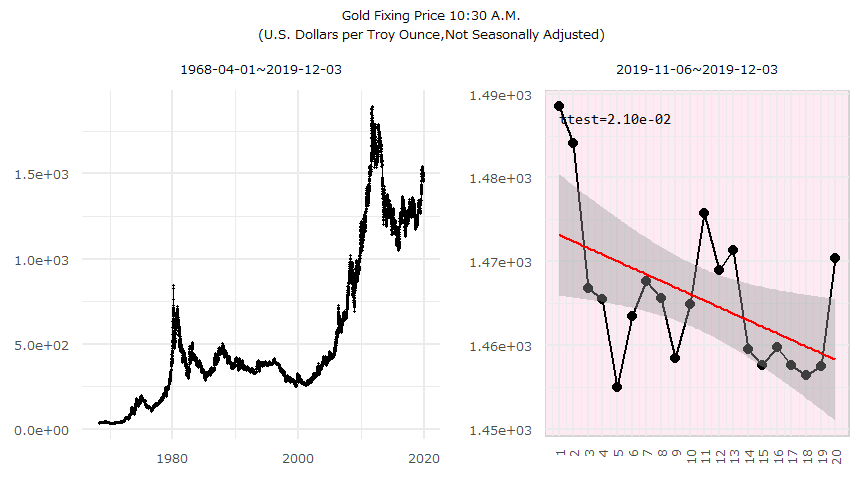
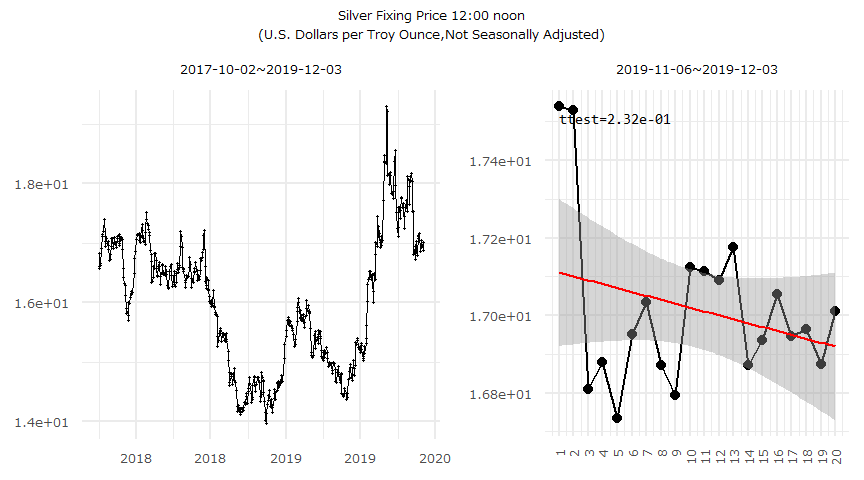
| Date | 12-03 | 12-02 | 11-29 | 11-28 | 11-27 |
|---|---|---|---|---|---|
| Gold Fixing Price 10:30 A.M.(U.S. Dollars per Troy Ounce,Not Seasonally Adjusted) | 1,470.4 | 1,457.5 | 1,456.35 | 1,457.55 | 1,459.8 |
| Silver Fixing Price 12:00 noon(U.S. Dollars per Troy Ounce,Not Seasonally Adjusted) | 17.01 | 16.875 | 16.965 | 16.945 | 17.055 |
暗号資産
- Source:Coinbase,FRED
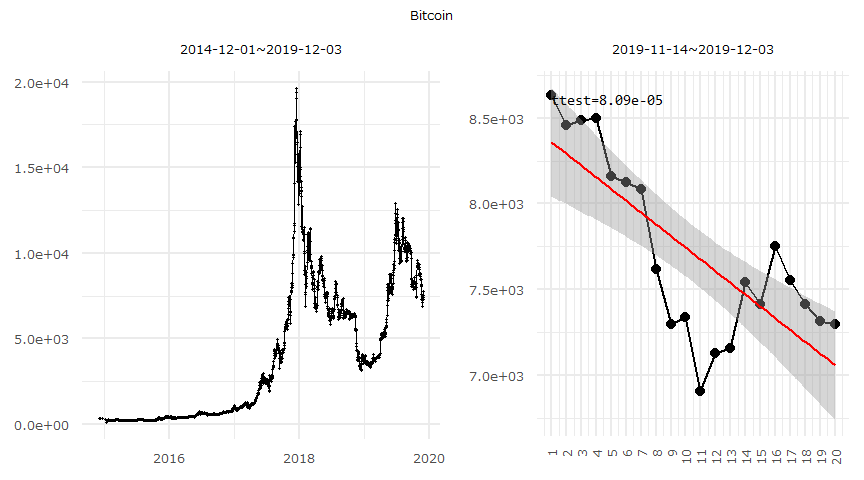
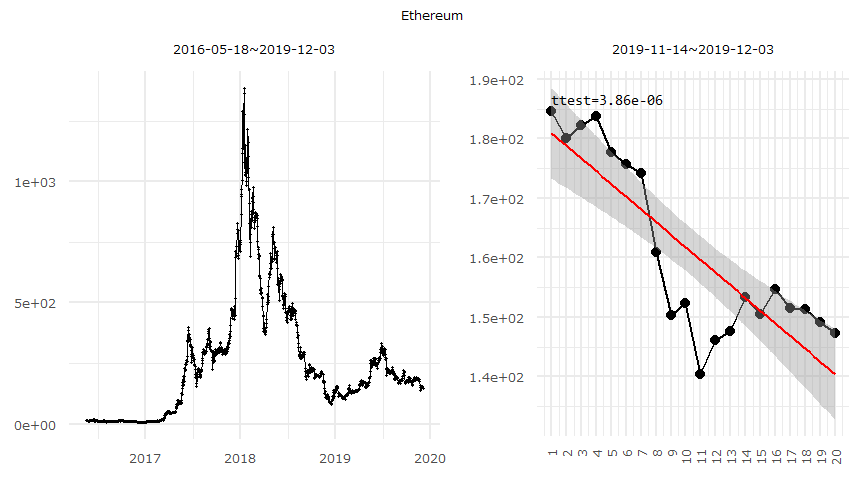
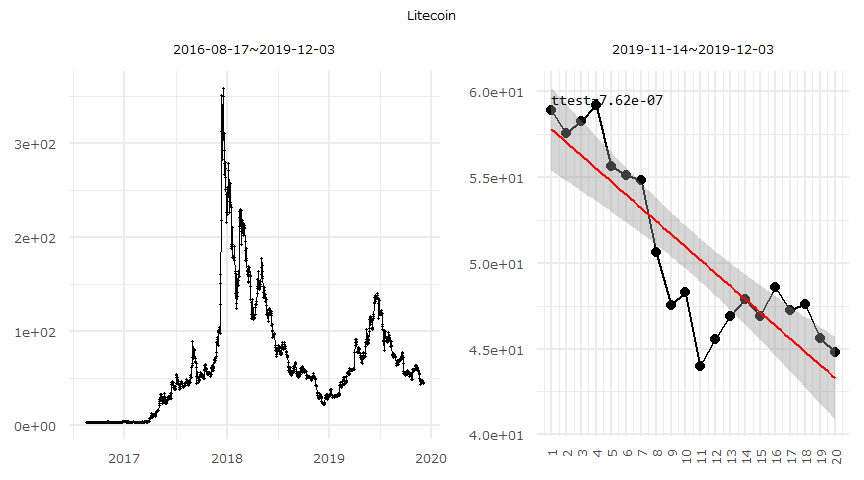
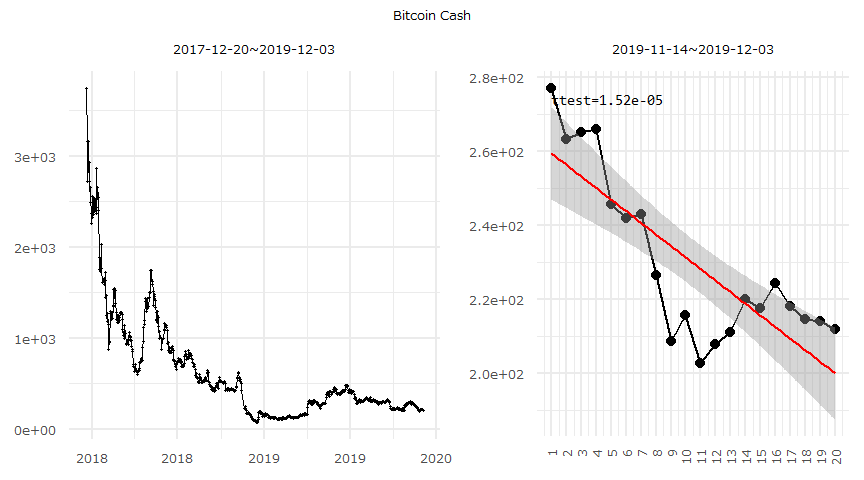
| Date | 12-03 | 12-02 | 12-01 | 11-30 | 11-29 |
|---|---|---|---|---|---|
| Bitcoin | 7,296 | 7,315.09 | 7,413.84 | 7,551.7 | 7,751.29 |
| Ethereum | 147.3 | 149.09 | 151.39 | 151.5 | 154.62 |
| Litecoin | 44.82 | 45.6 | 47.58 | 47.24 | 48.61 |
| Bitcoin Cash | 211.8 | 214 | 214.55 | 218 | 224.28 |
Palladium & Platinum
- Source:OANDA
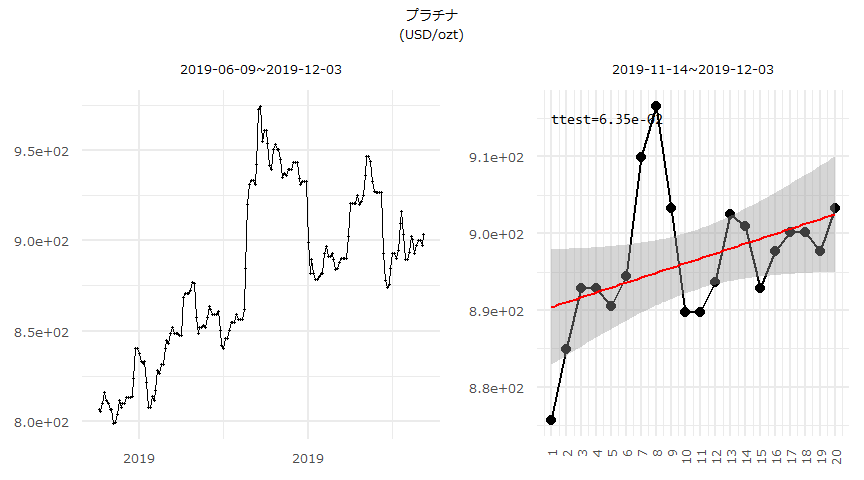
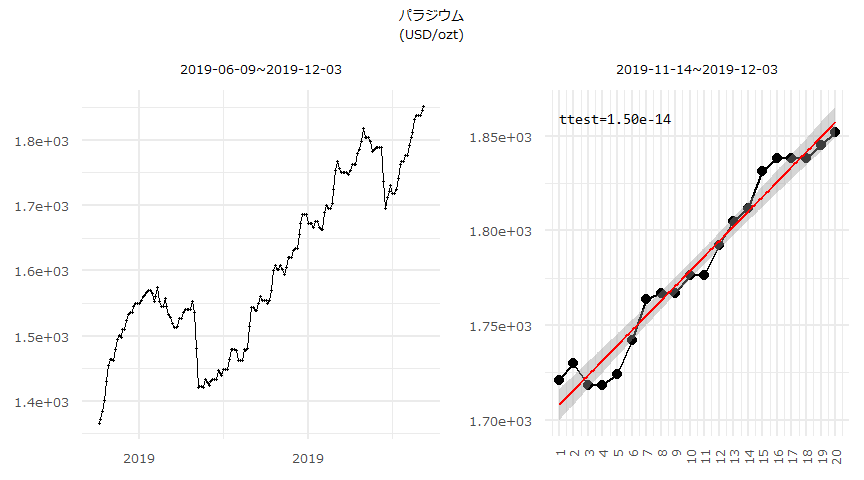
| Date | 12-03 | 12-02 | 12-01 | 11-30 | 11-29 |
|---|---|---|---|---|---|
| プラチナ(USD/ozt) | 903.3424 | 897.6661 | 900.09 | 900.09 | 897.6661 |
| パラジウム(USD/ozt) | 1,851.852 | 1,845.018 | 1,838.235 | 1,838.235 | 1,838.235 |
Crude oil:WTI & Brent
- Source:FRED
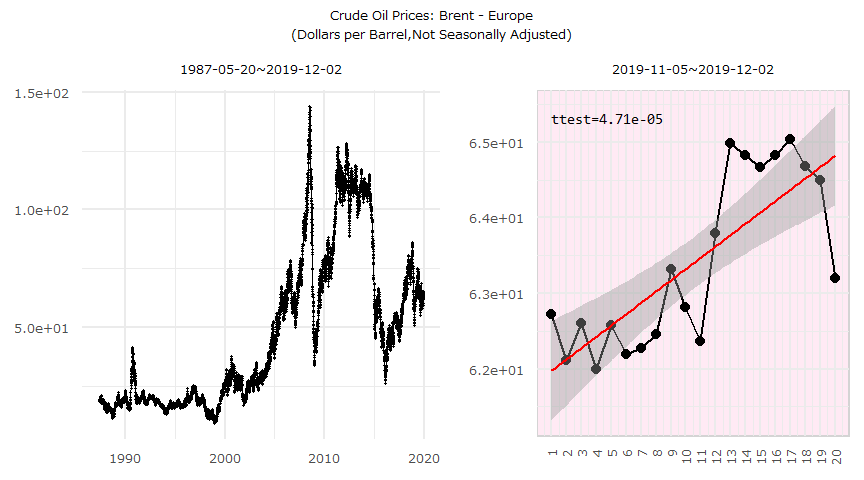
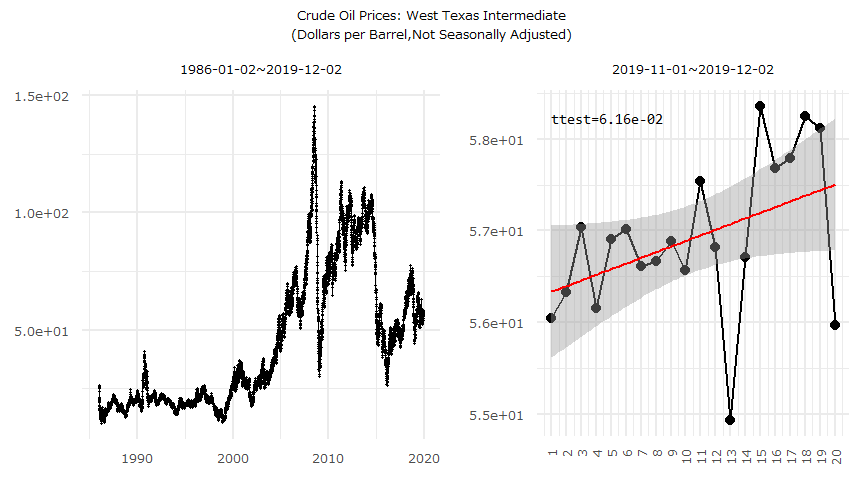
| Date | 12-02 | 11-29 | 11-28 | 11-27 | 11-26 |
|---|---|---|---|---|---|
| Crude Oil Prices: Brent - Europe(Dollars per Barrel,Not Seasonally Adjusted) | 63.2 | 64.5 | 64.68 | 65.03 | 64.82 |
| Crude Oil Prices: West Texas Intermediate(Dollars per Barrel,Not Seasonally Adjusted) | 55.97 | NA | NA | 58.12 | 58.25 |
米国石油週間在庫報告