Taiwan Semiconductor Manufacturing Company Limited(TSM)
0.432
-1.04
28
Teradyne, Inc.(TER)
-0.829
-0.55
29
Texas Instruments Incorporated(TXN)
0.493
-0.708
30
Xilinx, Inc.(XLNX)
0.0921
-0.752
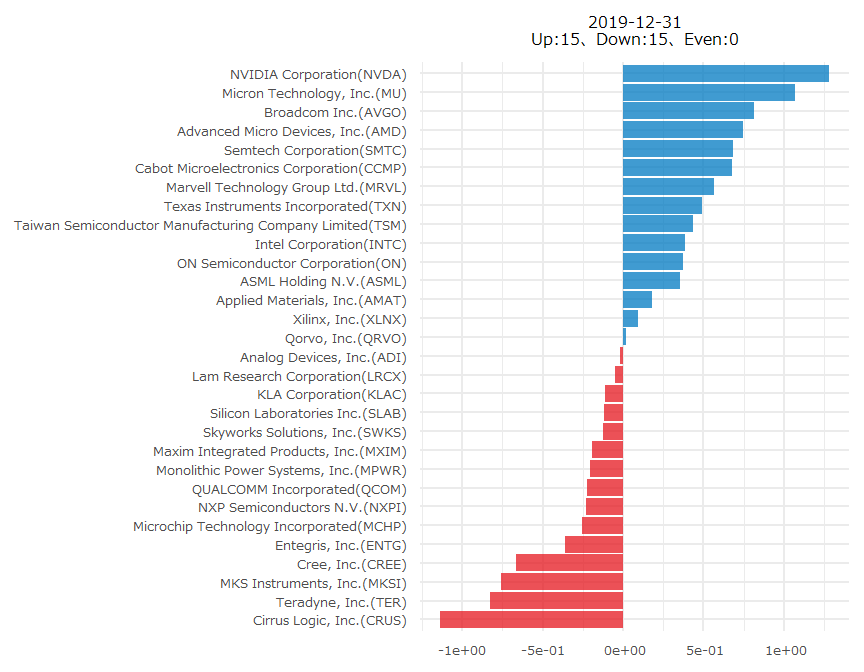
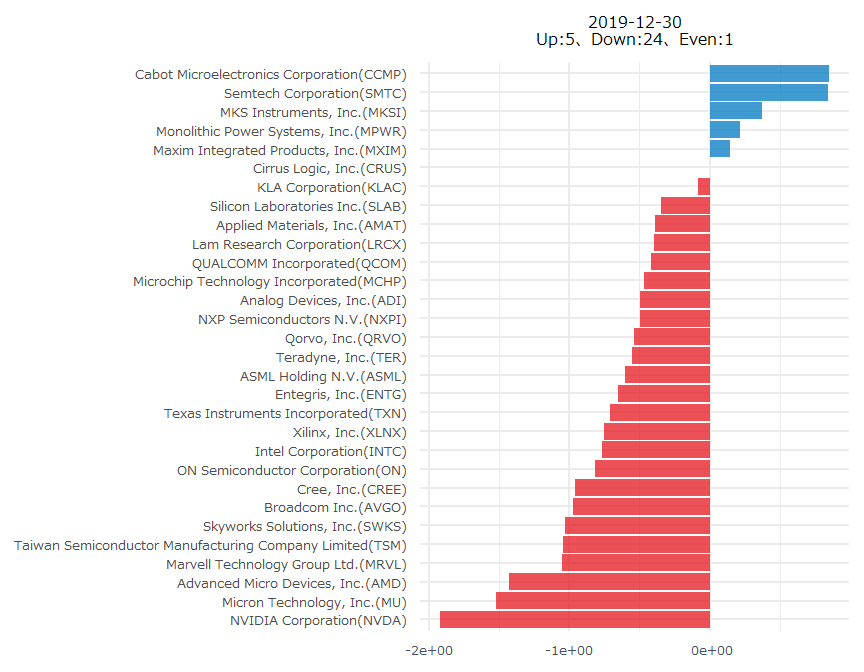
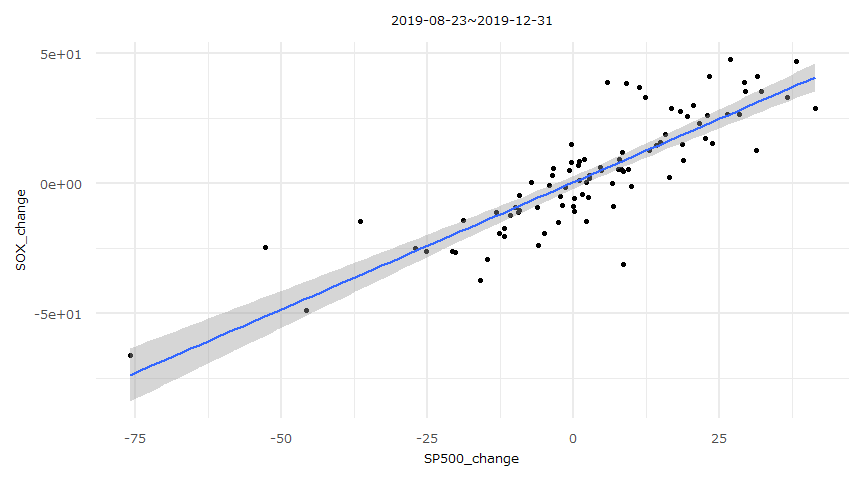
S&P500とフィラデルフィア半導体株指数(SOX)の相関
Souece:Yahoo Finance
指数構成銘柄の重複は考慮していません。
[1] "2019-08-22~2019-12-31"
$`S&P500`

    Augmented Dickey-Fuller Test

data:  timeseries
Dickey-Fuller = -1.9123, Lag order = 4, p-value = 0.6123
alternative hypothesis: stationary


$SOX

    Augmented Dickey-Fuller Test

data:  timeseries
Dickey-Fuller = -2.3638, Lag order = 4, p-value = 0.4264
alternative hypothesis: stationary


$SP500_change

    Augmented Dickey-Fuller Test

data:  timeseries
Dickey-Fuller = -4.1152, Lag order = 4, p-value = 0.01
alternative hypothesis: stationary


$SOX_change

    Augmented Dickey-Fuller Test

data:  timeseries
Dickey-Fuller = -4.1581, Lag order = 4, p-value = 0.01
alternative hypothesis: stationary
########################################
# Phillips and Ouliaris Unit Root Test #
########################################

Test of type Pu
detrending of series none


Call:
lm(formula = z[, 1] ~ z[, -1] - 1)

Residuals:
     Min       1Q   Median       3Q      Max
-199.239  -77.554    7.754   80.885  199.304

Coefficients:
        Estimate Std. Error t value            Pr(>|t|)
z[, -1] 1.837944   0.006626   277.4 <0.0000000000000002 ***
---
Signif. codes:  0 '***' 0.001 '**' 0.01 '*' 0.05 '.' 0.1 ' ' 1

Residual standard error: 104.7 on 90 degrees of freedom
Multiple R-squared:  0.9988,    Adjusted R-squared:  0.9988
F-statistic: 7.695e+04 on 1 and 90 DF,  p-value: < 0.00000000000000022


Value of test-statistic is: 0.5637

Critical values of Pu are:
                  10pct    5pct    1pct
critical values 20.3933 25.9711 38.3413
MODEL INFO:
Observations: 90
Dependent Variable: SOX_change
Type: Linear regression

MODEL FIT:
χ2(1) = 32070.93, p = 0.00
Pseudo-R2 (Cragg-Uhler) = 0.73
Pseudo-R2 (McFadden) = 0.15
AIC = 700.21, BIC = 707.71

Standard errors: MLE
---------------------------------------------------------
                     Est.    2.5%   97.5%   t val.      p
------------------ ------ ------- ------- -------- ------
(Intercept)          0.41   -2.02    2.84     0.33   0.74
SP500_change         0.98    0.85    1.10    15.47   0.00
---------------------------------------------------------

Estimated dispersion parameter = 134.03
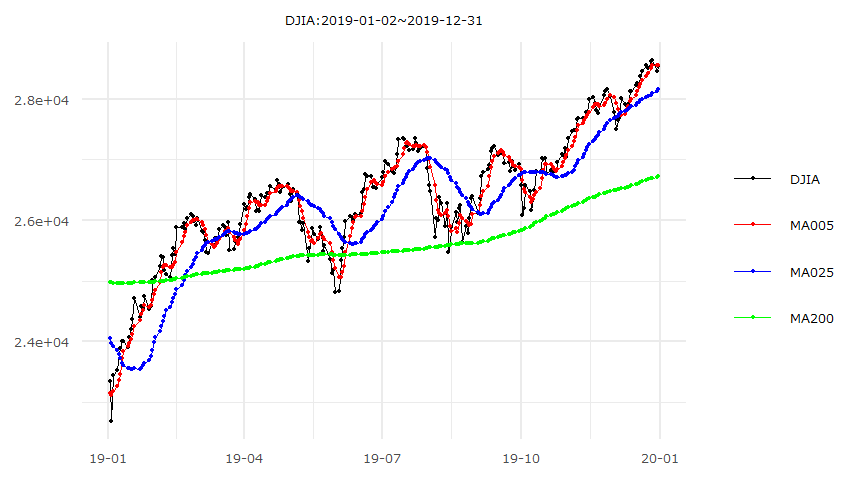
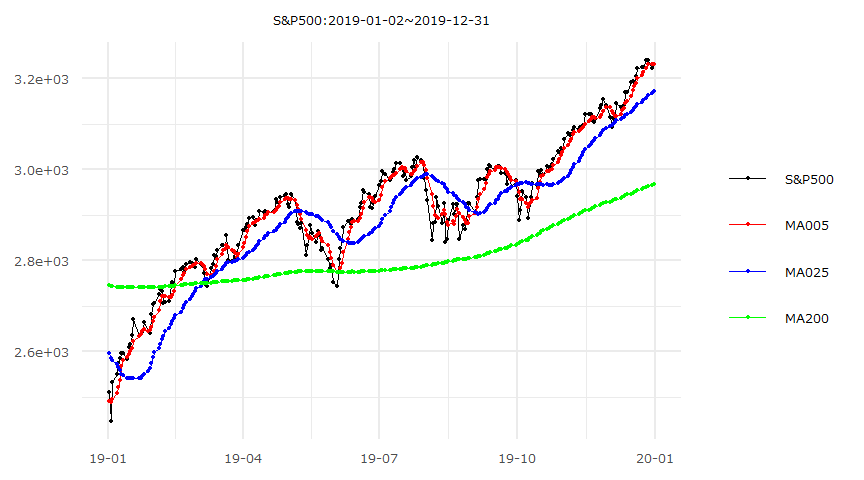
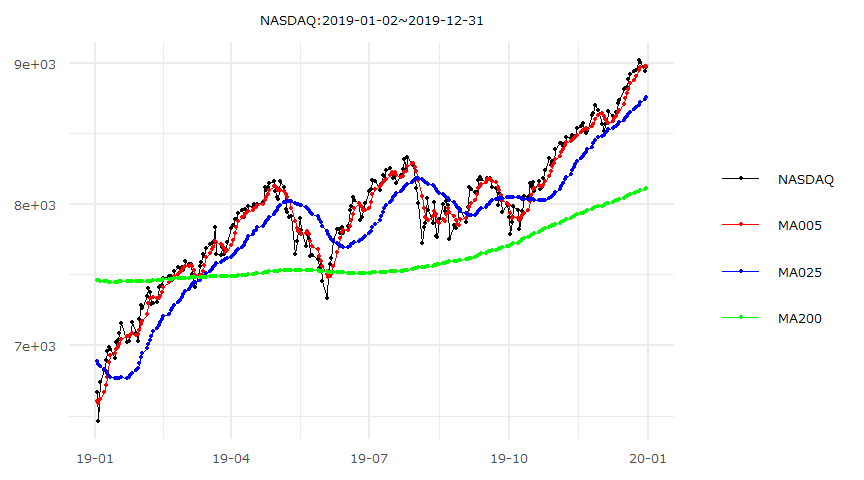
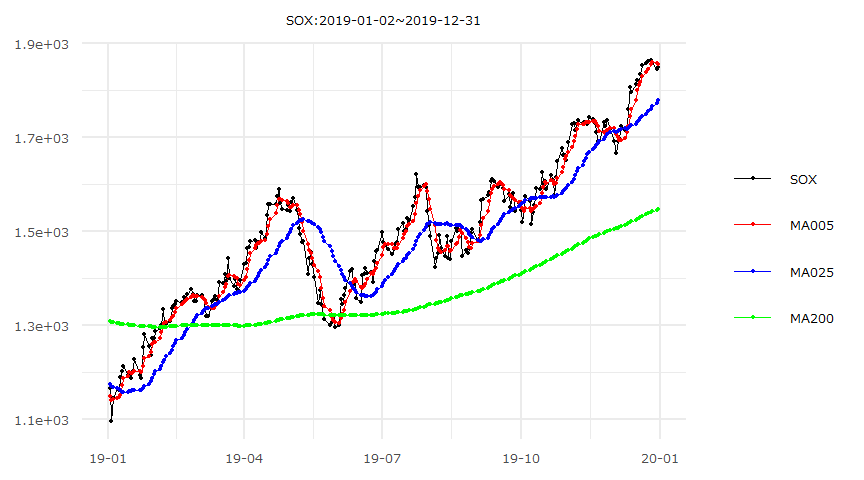
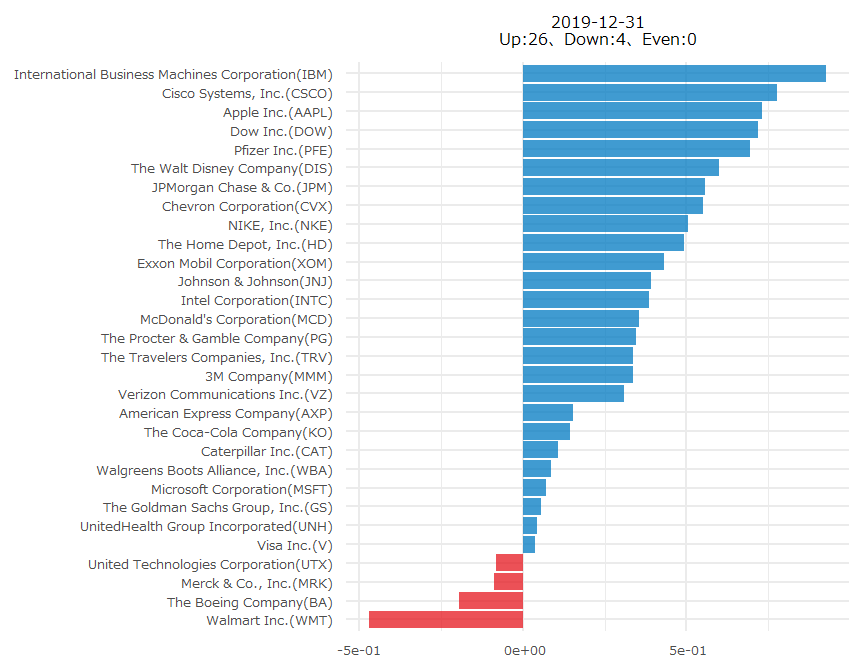
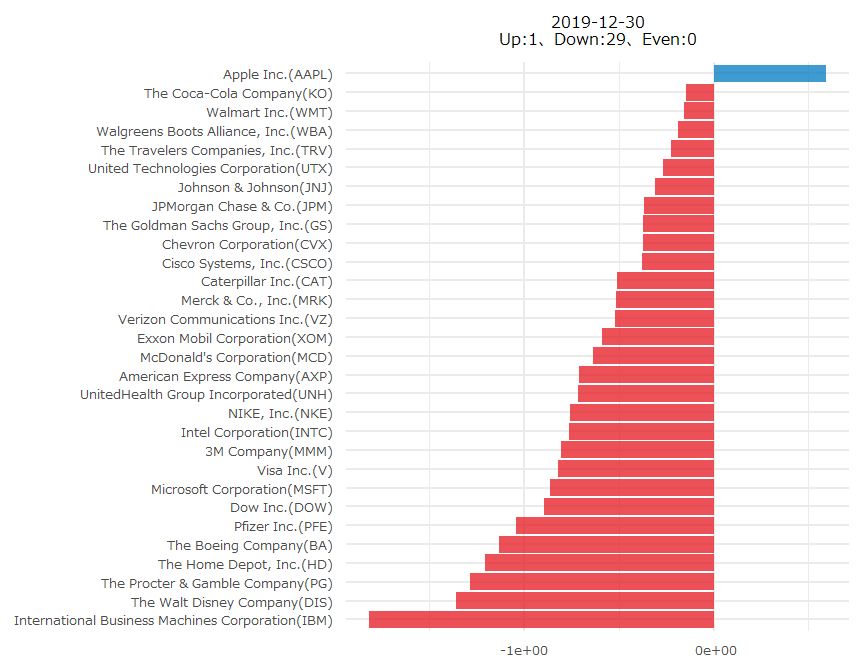
米国主要株価指数