Content
単位根検定・共和分検定
- CADFtest {CADFtest}
- ca.po {urca}
単位根検定
[1] "2019-05-10~2019-09-12"
[1] "n=90"

$DOW30

    ADF test

data:  x
ADF(0) = -1.7825, p-value = 0.7048
alternative hypothesis: true delta is less than 0
sample estimates:
     delta
-0.0736528


$NIKKEI225

    ADF test

data:  x
ADF(0) = -1.5483, p-value = 0.805
alternative hypothesis: true delta is less than 0
sample estimates:
      delta
-0.07242302


$DOW30_Change

    ADF test

data:  x
ADF(0) = -9.7307, p-value = 0.000000000009647
alternative hypothesis: true delta is less than 0
sample estimates:
    delta
-1.055849


$NIKKEI225_Change

    ADF test

data:  x
ADF(0) = -9.4728, p-value = 0.00000000002239
alternative hypothesis: true delta is less than 0
sample estimates:
    delta
-1.033889
共和分検定
[1] "2019-05-10~2019-09-12"
[1] "n=90"
[1] "DOW30 × NIKKEI225"
########################################
# Phillips and Ouliaris Unit Root Test #
########################################
Test of type Pu
detrending of series none
Call:
lm(formula = z[, 1] ~ z[, -1] - 1)
Residuals:
Min 1Q Median 3Q Max
-1148.81 -273.70 73.55 393.96 992.98
Coefficients:
Estimate Std. Error t value Pr(>|t|)
z[, -1] 1.246303 0.002453 508 <0.0000000000000002 ***
---
Signif. codes: 0 '***' 0.001 '**' 0.01 '*' 0.05 '.' 0.1 ' ' 1
Residual standard error: 491.5 on 89 degrees of freedom
Multiple R-squared: 0.9997, Adjusted R-squared: 0.9997
F-statistic: 2.581e+05 on 1 and 89 DF, p-value: < 0.00000000000000022
Value of test-statistic is: 14.112
Critical values of Pu are:
10pct 5pct 1pct
critical values 20.3933 25.9711 38.3413
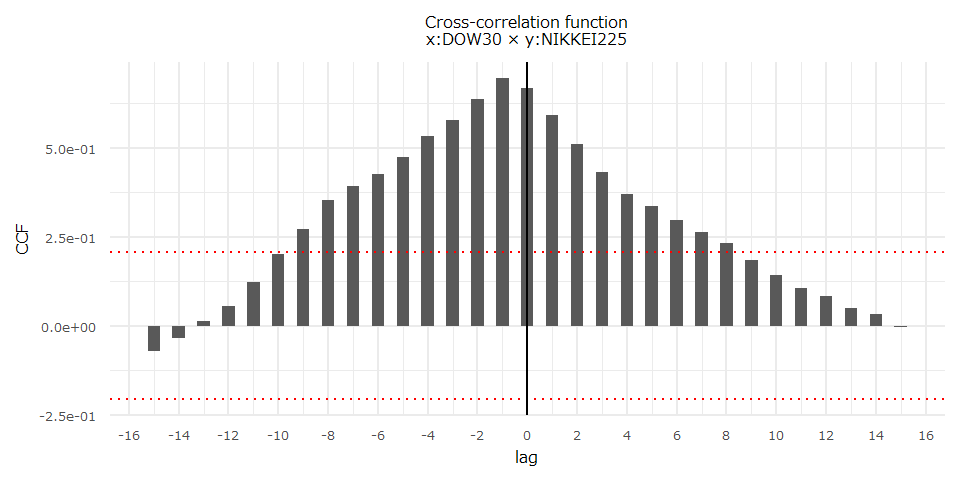
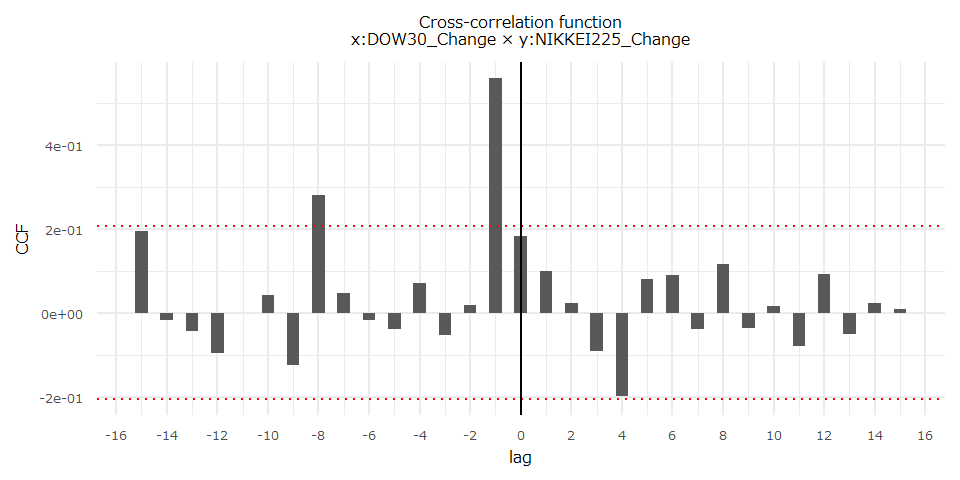
相互相関関数
- ggCcf {forecast}
ベクトル自己回帰モデル
- VARselect {vars}
- VAR {vars}
[1] "2019-05-10~2019-09-12"
[1] "n=90"


VAR Estimation Results:
=========================
Endogenous variables: DOW30, NIKKEI225
Deterministic variables: const
Sample size: 89
Log Likelihood: -1190.034
Roots of the characteristic polynomial:
0.9149 0.8442
Call:
VAR(y = obj, p = selected_lag, type = "const")


Estimation results for equation DOW30:
======================================
DOW30 = DOW30.l1 + NIKKEI225.l1 + const

               Estimate Std. Error t value            Pr(>|t|)
DOW30.l1        0.95839    0.05215  18.376 <0.0000000000000002 ***
NIKKEI225.l1   -0.04117    0.07948  -0.518               0.606
const        1977.50219 1287.98879   1.535               0.128
---
Signif. codes:  0 '***' 0.001 '**' 0.01 '*' 0.05 '.' 0.1 ' ' 1


Residual standard error: 236.6 on 86 degrees of freedom
Multiple R-Squared: 0.8702, Adjusted R-squared: 0.8672
F-statistic: 288.2 on 2 and 86 DF,  p-value: < 0.00000000000000022


Estimation results for equation NIKKEI225:
==========================================
NIKKEI225 = DOW30.l1 + NIKKEI225.l1 + const

               Estimate Std. Error t value            Pr(>|t|)
DOW30.l1        0.12063    0.03700   3.260              0.0016 **
NIKKEI225.l1    0.80070    0.05638  14.201 <0.0000000000000002 ***
const        1037.83743  913.73636   1.136              0.2592
---
Signif. codes:  0 '***' 0.001 '**' 0.01 '*' 0.05 '.' 0.1 ' ' 1


Residual standard error: 167.9 on 86 degrees of freedom
Multiple R-Squared: 0.8492, Adjusted R-squared: 0.8457
F-statistic: 242.2 on 2 and 86 DF,  p-value: < 0.00000000000000022


Covariance matrix of residuals:
          DOW30 NIKKEI225
DOW30     55993      8261
NIKKEI225  8261     28181

Correlation matrix of residuals:
          DOW30 NIKKEI225
DOW30     1.000     0.208
NIKKEI225 0.208     1.000
[1] "2019-05-10~2019-09-12"
[1] "n=90"
VAR Estimation Results:
=========================
Endogenous variables: DOW30_Change, NIKKEI225_Change
Deterministic variables: const
Sample size: 89
Log Likelihood: -205.76
Roots of the characteristic polynomial:
0.3807 0.1457
Call:
VAR(y = obj, p = selected_lag, type = "const")
Estimation results for equation DOW30_Change:
=============================================
DOW30_Change = DOW30_Change.l1 + NIKKEI225_Change.l1 + const
Estimate Std. Error t value Pr(>|t|)
DOW30_Change.l1 -0.11047 0.10838 -1.019 0.311
NIKKEI225_Change.l1 0.12746 0.11644 1.095 0.277
const 0.06143 0.09671 0.635 0.527
Residual standard error: 0.9103 on 86 degrees of freedom
Multiple R-Squared: 0.02154, Adjusted R-squared: -0.001213
F-statistic: 0.9467 on 2 and 86 DF, p-value: 0.392
Estimation results for equation NIKKEI225_Change:
=================================================
NIKKEI225_Change = DOW30_Change.l1 + NIKKEI225_Change.l1 + const
Estimate Std. Error t value Pr(>|t|)
DOW30_Change.l1 0.543214 0.084023 6.465 0.00000000588 ***
NIKKEI225_Change.l1 -0.124549 0.090270 -1.380 0.171
const -0.005501 0.074972 -0.073 0.942
---
Signif. codes: 0 '***' 0.001 '**' 0.01 '*' 0.05 '.' 0.1 ' ' 1
Residual standard error: 0.7058 on 86 degrees of freedom
Multiple R-Squared: 0.3273, Adjusted R-squared: 0.3116
F-statistic: 20.92 on 2 and 86 DF, p-value: 0.00000003953
Covariance matrix of residuals:
DOW30_Change NIKKEI225_Change
DOW30_Change 0.8287 0.1968
NIKKEI225_Change 0.1968 0.4981
Correlation matrix of residuals:
DOW30_Change NIKKEI225_Change
DOW30_Change 1.0000 0.3063
NIKKEI225_Change 0.3063 1.0000
グレンジャー因果
- causality {vars}
Dow → Nikkei
[1] "2019-05-10~2019-09-12"
[1] "n=90"


    Granger causality H0: DOW30_Change do not Granger-cause NIKKEI225_Change

data:  VAR object var_result
F-Test = 41.797, df1 = 1, df2 = 172, p-value = 0.000000001008
Nikkei → Dow
[1] "2019-05-10~2019-09-12"
[1] "n=90"
Granger causality H0: NIKKEI225_Change do not Granger-cause DOW30_Change
data: VAR object var_result
F-Test = 1.1983, df1 = 1, df2 = 172, p-value = 0.2752
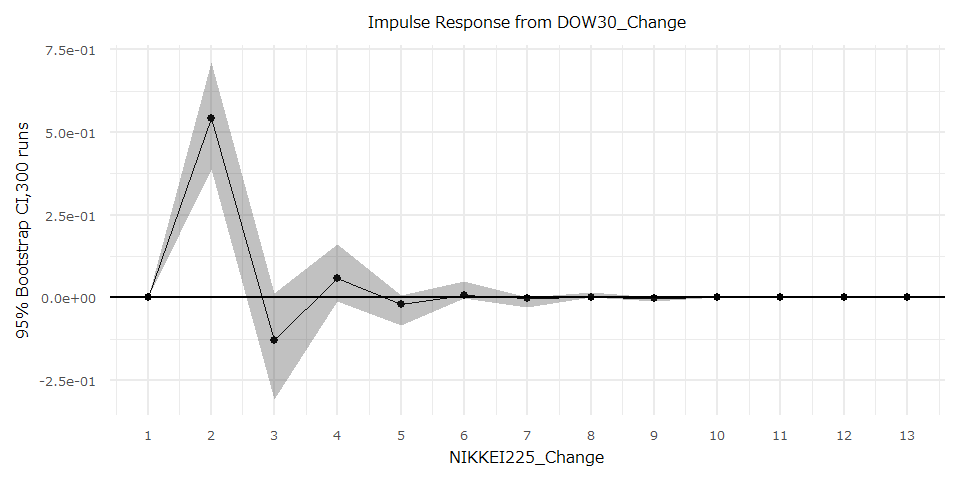
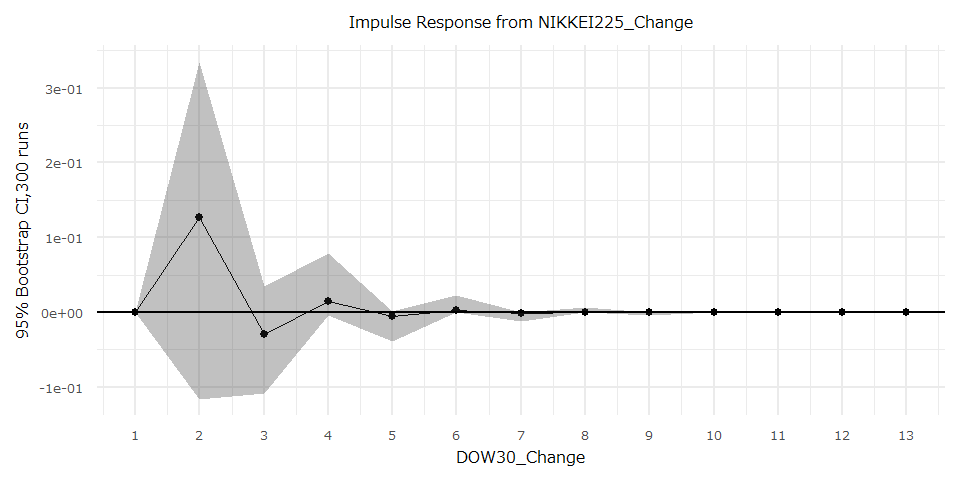
インパルス応答
- irf {vars}
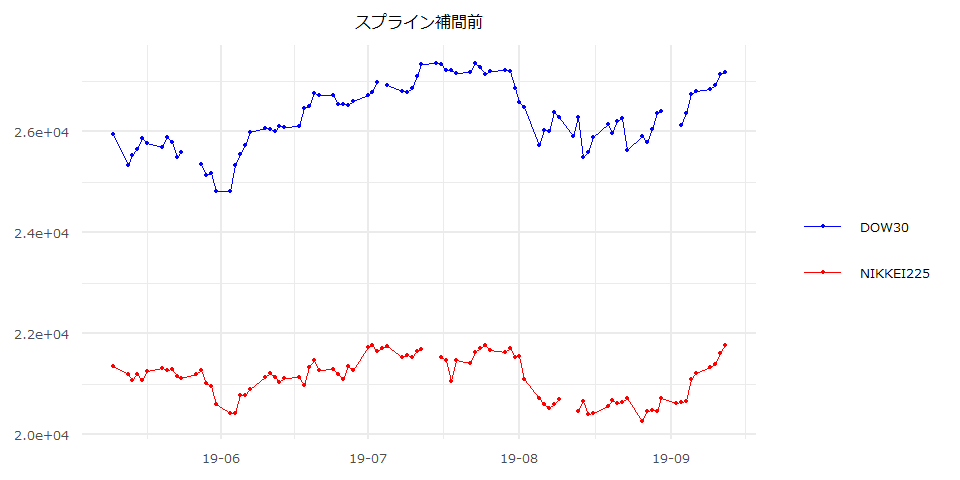
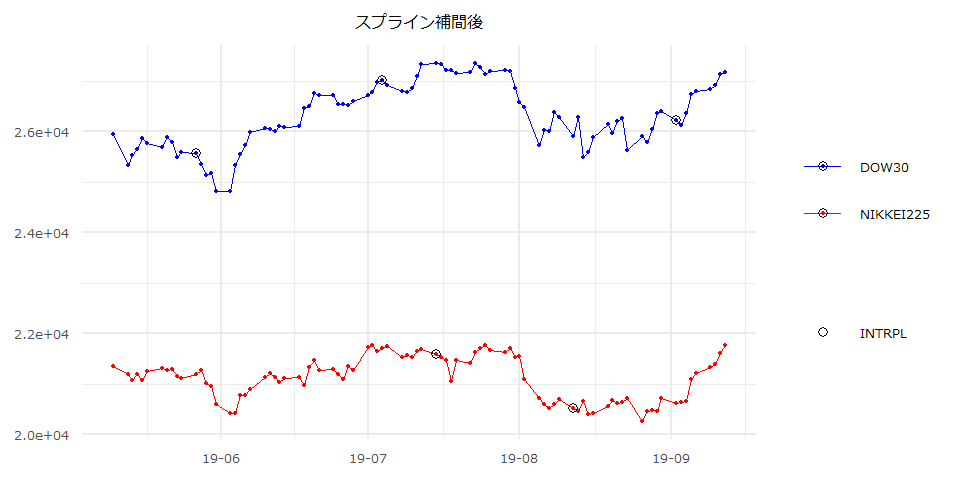
時系列チャート