要は米国、つまりは米国、総ては米国
- 米国のファンダメンタルズ(雇用統計、失業保険、フィラデルフィア連銀製造業景気指数、ミシガン大学消費者態度指数、ケース・シラー住宅価格指数、新築住宅販売件数ほか) -
Updated time:2020-03-12 17:55:37
-
Social and Economic Data(YouTube Video)
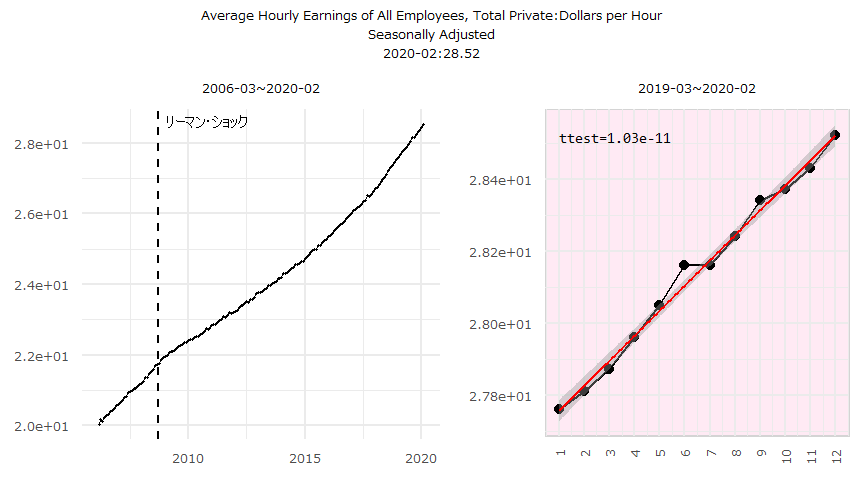
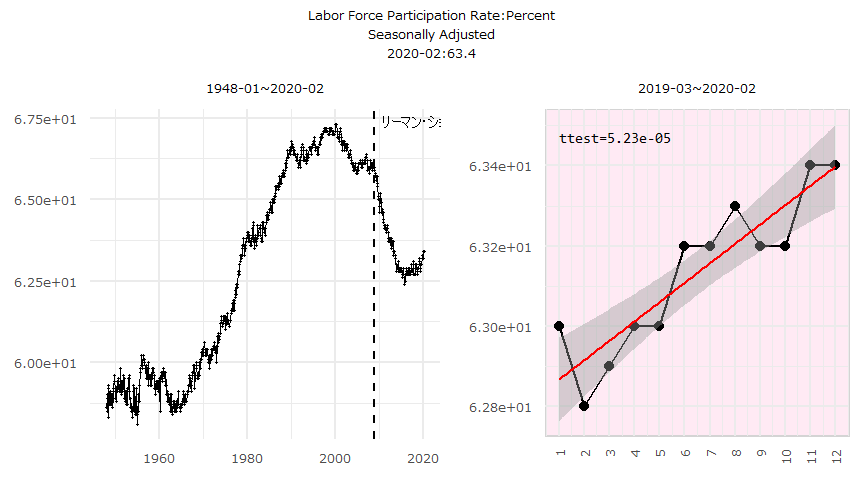
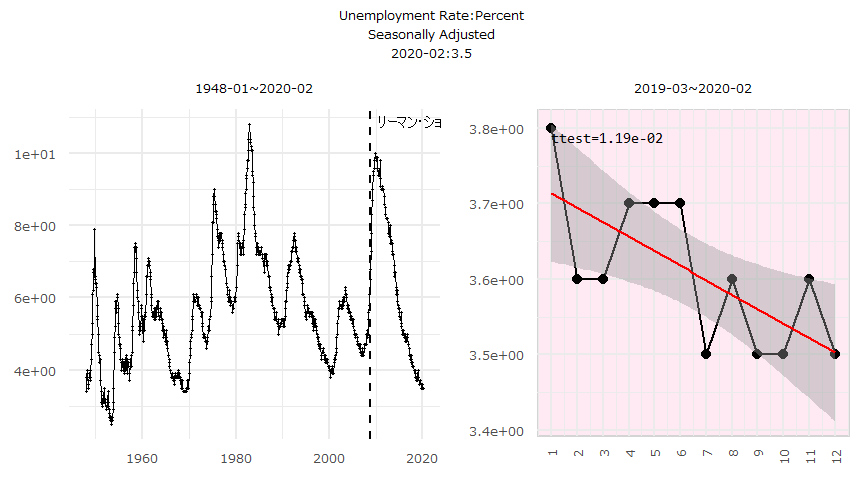
雇用統計


| Date | 2020-02 | 2020-01 | 2019-12 | 2019-11 | 2019-10 |
|---|---|---|---|---|---|
| All Employees, Total Nonfarm:Thousands of Persons,Seasonally Adjusted | 152,544 | 152,271 | 151,998 | 151,814 | 151,553 |
| Average Hourly Earnings of All Employees, Total Private:Dollars per Hour,Seasonally Adjusted | 28.52 | 28.43 | 28.37 | 28.34 | 28.24 |
| Average Weekly Hours of All Employees, Total Private:Hours,Seasonally Adjusted | 34.4 | 34.3 | 34.3 | 34.3 | 34.4 |
| Labor Force Participation Rate:Percent,Seasonally Adjusted | 63.4 | 63.4 | 63.2 | 63.2 | 63.3 |
| Unemployment Rate:Percent,Seasonally Adjusted | 3.5 | 3.6 | 3.5 | 3.5 | 3.6 |
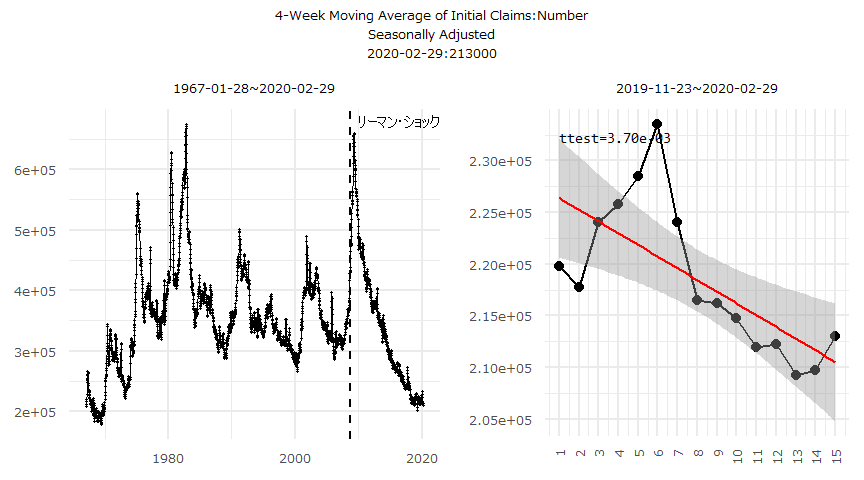
失業保険
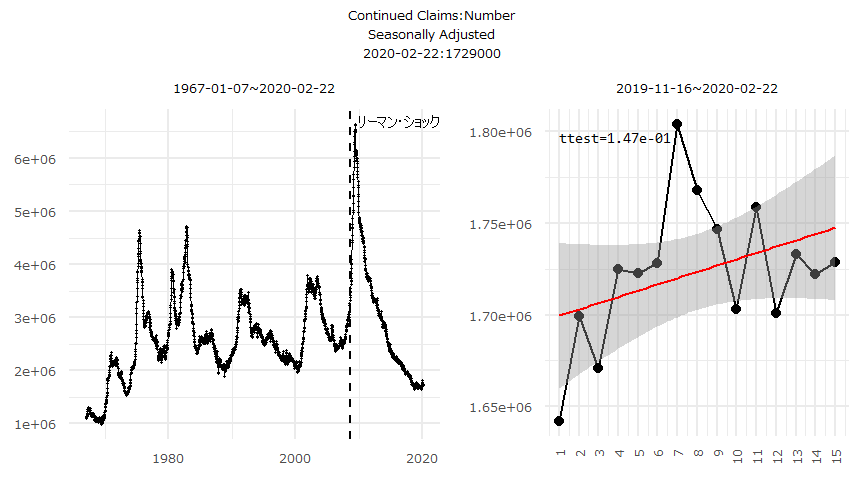

| Date | 02-29 | 02-22 | 02-15 | 02-08 | 02-01 |
|---|---|---|---|---|---|
| 4-Week Moving Average of Initial Claims:Number,Seasonally Adjusted | 213,000 | 209,750 | 209,250 | 212,250 | 212,000 |
| Continued Claims:Number,Seasonally Adjusted | NA | 1,729,000 | 1,722,000 | 1,733,000 | 1,701,000 |
| Initial Claims:Number,Seasonally Adjusted | 216,000 | 219,000 | 211,000 | 206,000 | 203,000 |
フィラデルフィア連銀製造業景気指数:Philadelphia Fed Manufacturing Business Outlook Survey
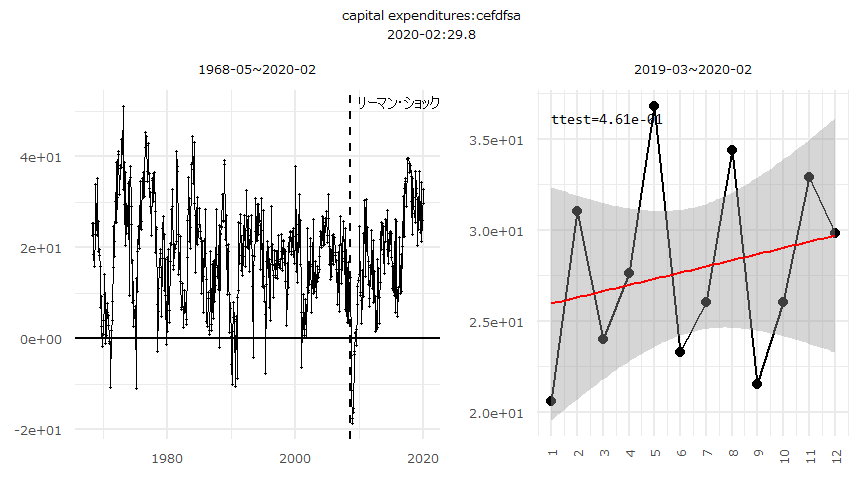


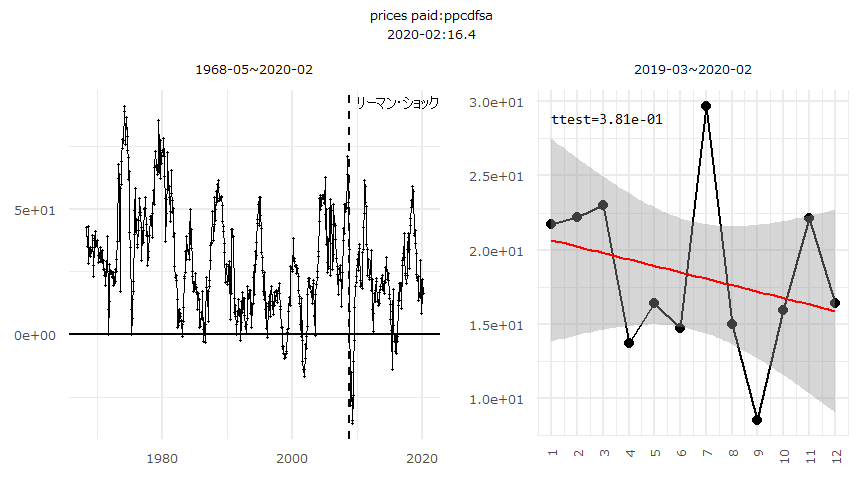
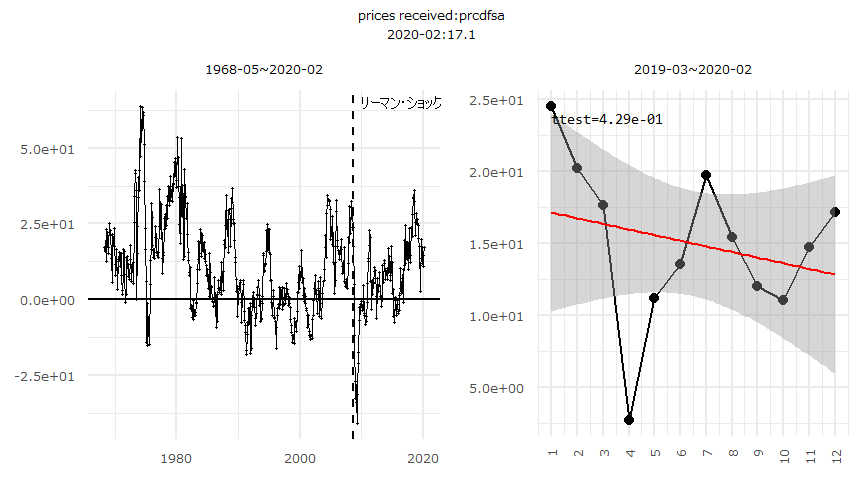


| Date | 2020-02 | 2020-01 | 2019-12 | 2019-11 | 2019-10 |
|---|---|---|---|---|---|
| capital expenditures:cefdfsa | 29.8 | 32.9 | 26 | 21.5 | 34.4 |
| delivery time:dtcdfsa | 2.7 | -0.4 | 12.5 | 9.7 | 9.3 |
| employment:necdfsa | 9.8 | 19.3 | 16.8 | 19.7 | 27.1 |
| general activity:gacdfsa | 36.7 | 17 | 2.4 | 8.4 | 6.8 |
| inventories:ivcdfsa | 11.8 | -2.3 | 5 | -3.5 | 5.4 |
| new orders:nocdfsa | 33.6 | 18.2 | 11.1 | 10.1 | 22.5 |
| prices paid:ppcdfsa | 16.4 | 22.1 | 15.9 | 8.5 | 15 |
| prices received:prcdfsa | 17.1 | 14.7 | 11 | 12 | 15.4 |
| shipments:shcdfsa | 25.2 | 23.4 | 15.7 | 13.4 | 19.3 |
| unfilled orders:uocdfsa | 7.4 | -3.7 | 8.6 | 8.2 | 14.5 |
| workhours:awcdfsa | 10.3 | 5.2 | 8.5 | 6.8 | 10.6 |
ミシガン大学消費者態度指数:Michigan Index

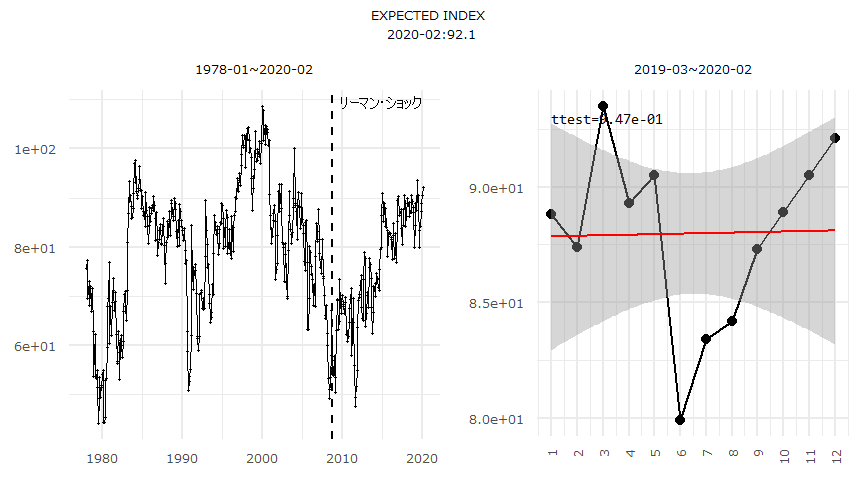
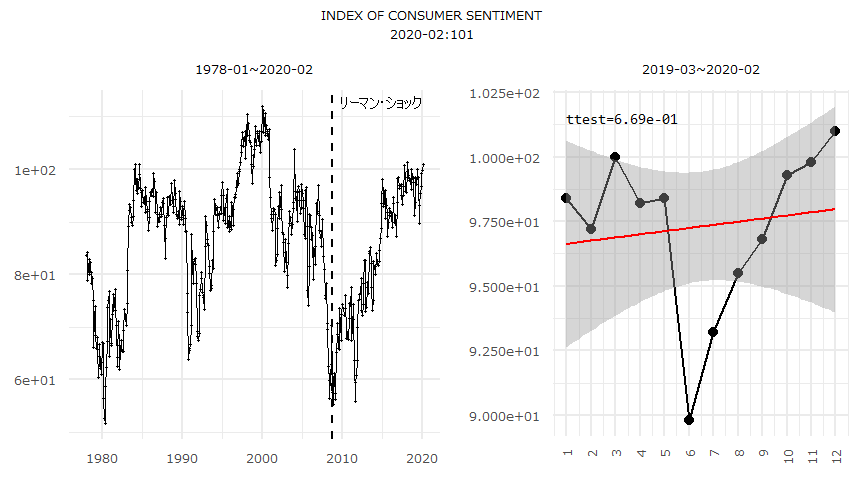

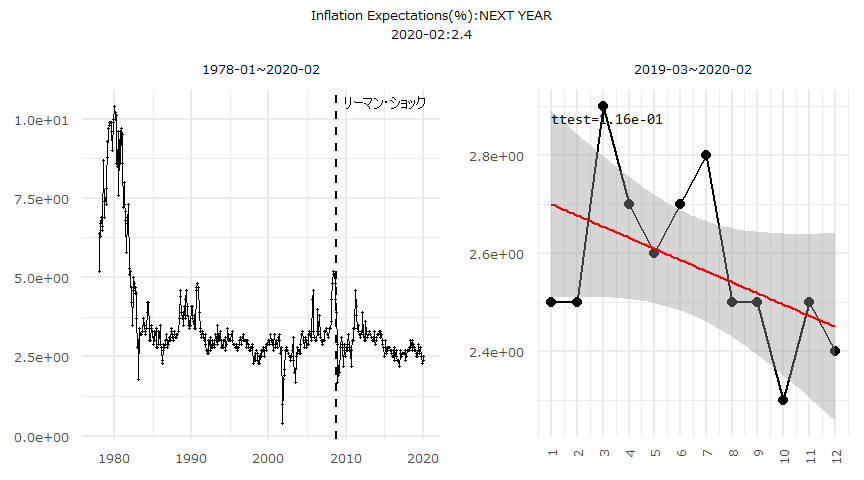
| Date | 2020-02 | 2020-01 | 2019-12 | 2019-11 | 2019-10 |
|---|---|---|---|---|---|
| CURRENT INDEX | 114.8 | 114.4 | 115.5 | 111.6 | 113.2 |
| EXPECTED INDEX | 92.1 | 90.5 | 88.9 | 87.3 | 84.2 |
| INDEX OF CONSUMER SENTIMENT | 101 | 99.8 | 99.3 | 96.8 | 95.5 |
| Inflation Expectations(%):NEXT 5 YEARS | 2.3 | 2.5 | 2.2 | 2.5 | 2.3 |
| Inflation Expectations(%):NEXT YEAR | 2.4 | 2.5 | 2.3 | 2.5 | 2.5 |
個人消費支出


| Date | 2020-01 | 2019-12 | 2019-11 | 2019-10 | 2019-09 |
|---|---|---|---|---|---|
| Personal Consumption Expenditures:Billions of Dollars,Seasonally Adjusted Annual Rate | 14,870.7 | 14,841 | 14,786.2 | 14,740.6 | 14,707.8 |
| Personal Consumption Expenditures Excluding Food and Energy:Index 2012=100,Seasonally Adjusted | 112.659 | 112.517 | 112.279 | 112.217 | 112.085 |
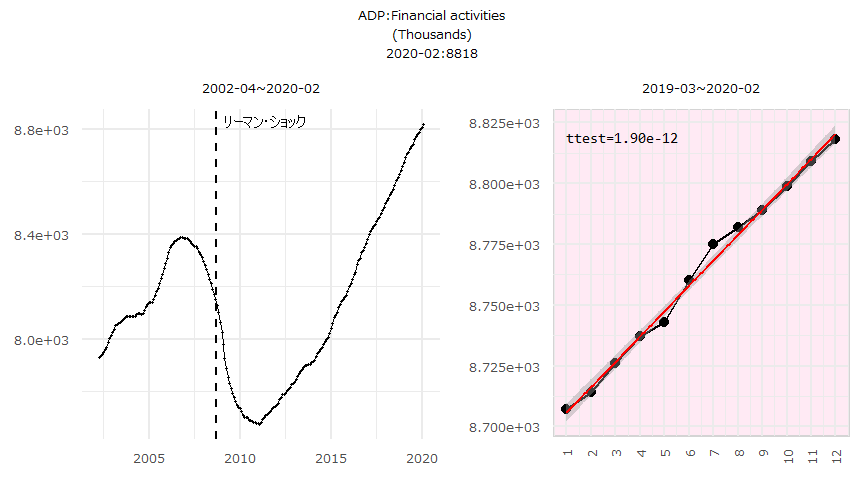
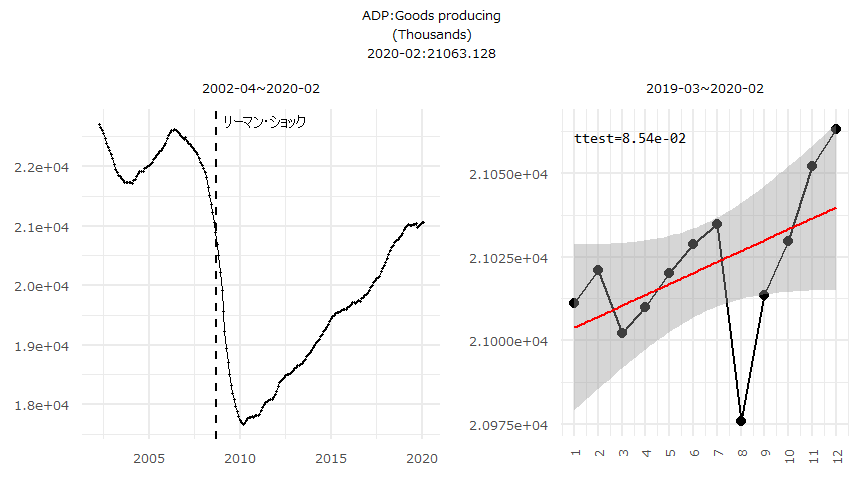
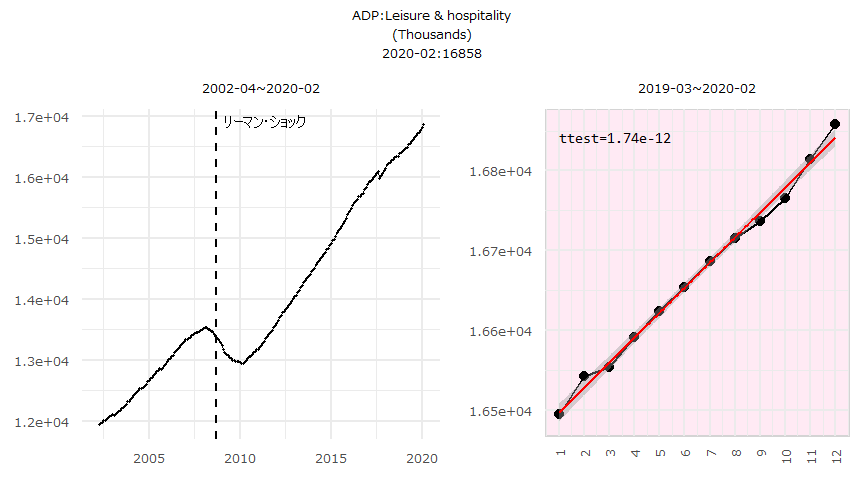
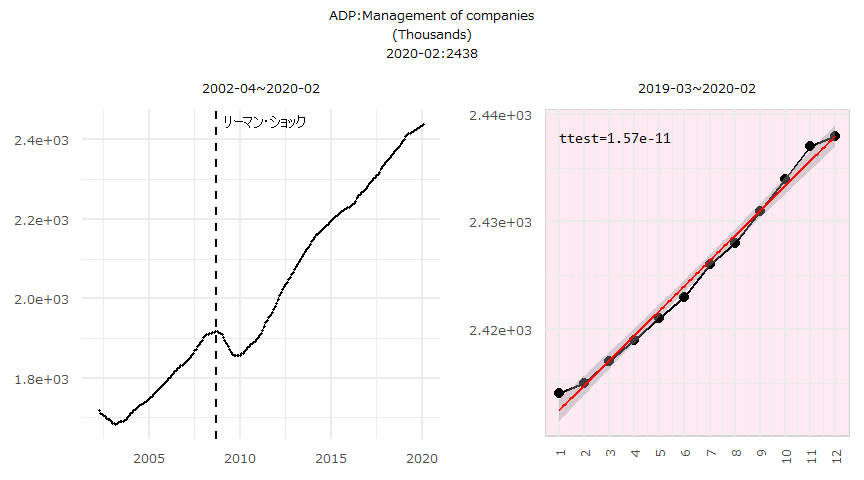
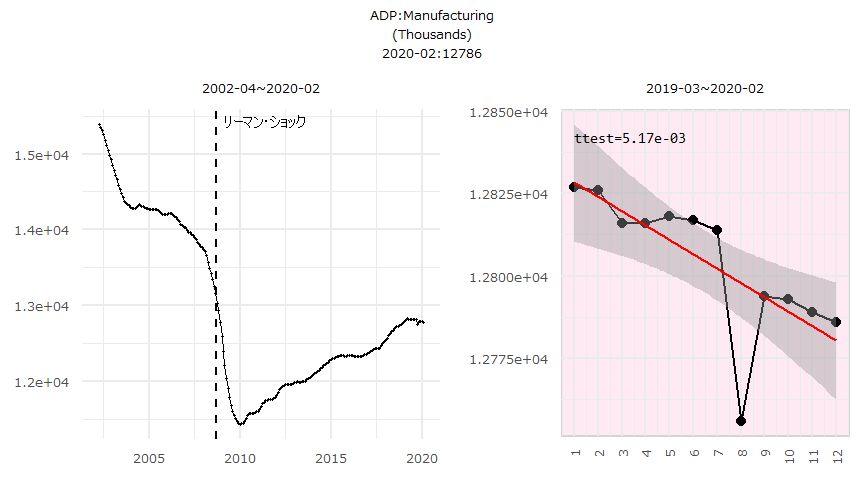
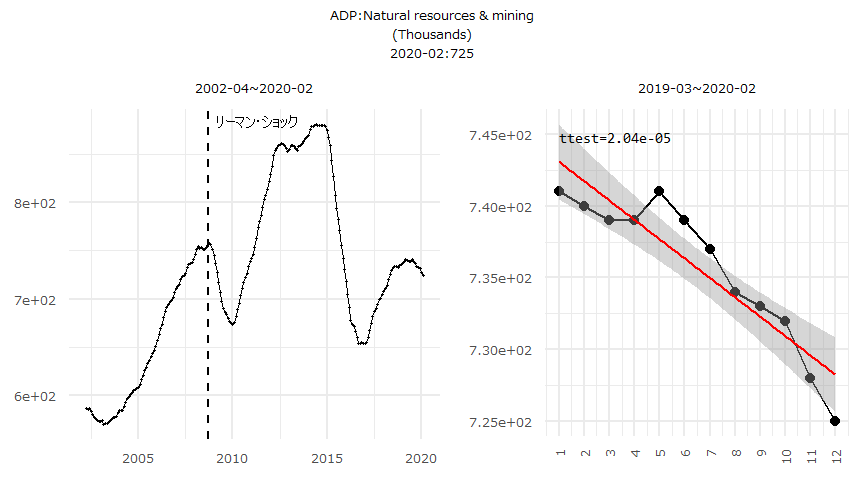
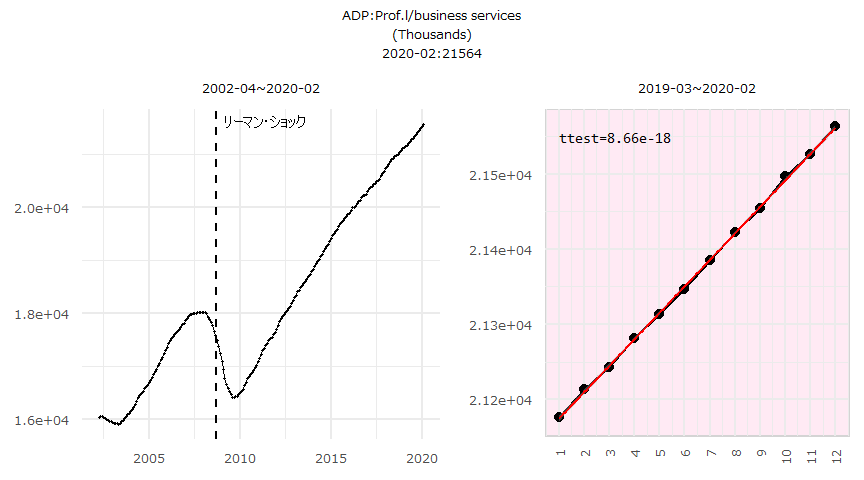
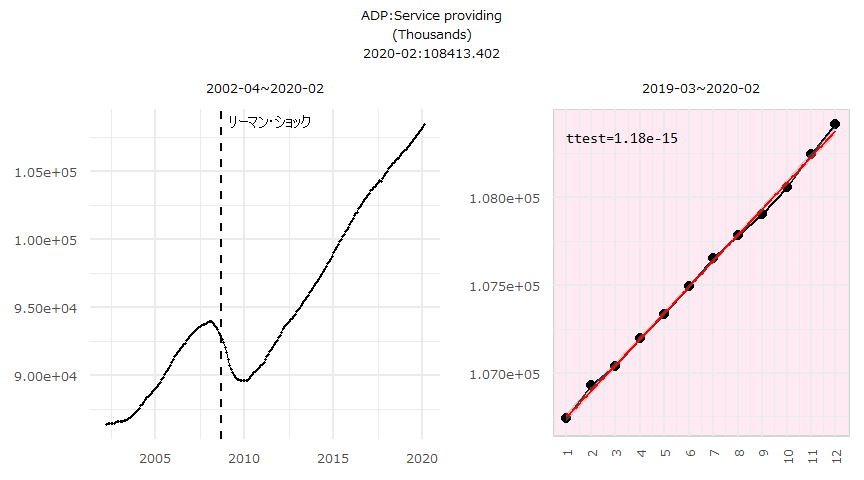
ADP雇用統計:ADP National Employment Report


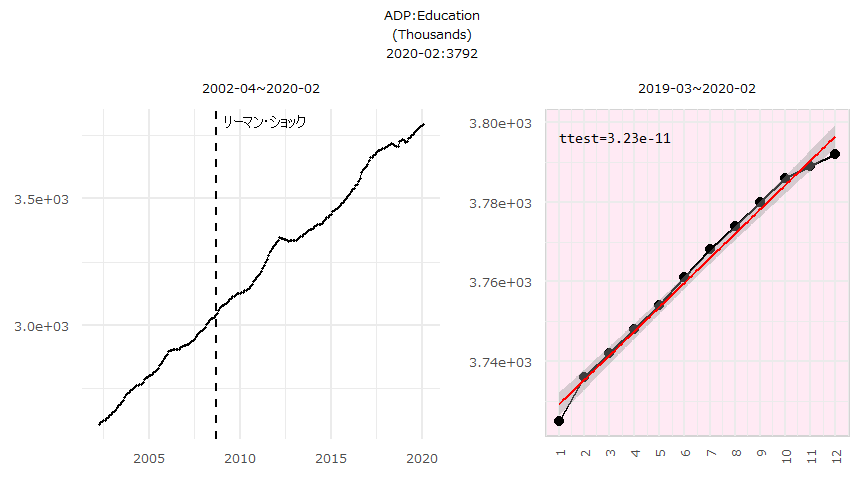


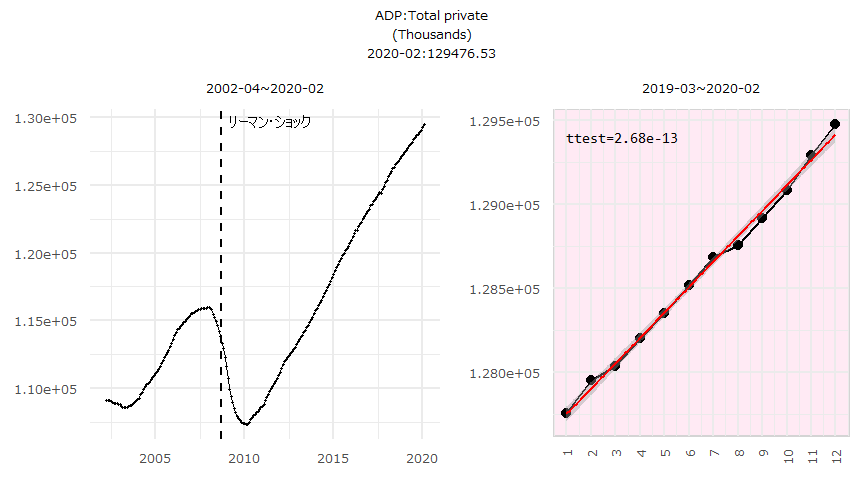

| Date | 2020-02 | 2020-01 | 2019-12 | 2019-11 | 2019-10 |
|---|---|---|---|---|---|
| ADP:Administrative & support services(Thousands) | 9,474 | 9,450 | 9,443 | 9,429 | 9,421 |
| ADP:Construction(Thousands) | 7,553 | 7,535 | 7,505 | 7,487 | 7,486 |
| ADP:Education & health services(Thousands) | 24,517 | 24,471 | 24,418 | 24,369 | 24,326 |
| ADP:Education(Thousands) | 3,792 | 3,789 | 3,786 | 3,780 | 3,774 |
| ADP:Financial activities(Thousands) | 8,818 | 8,809 | 8,799 | 8,789 | 8,782 |
| ADP:Goods producing(Thousands) | 21,063.13 | 21,052.07 | 21,029.76 | 21,013.36 | 20,975.81 |
| ADP:Healthcare(Thousands) | 20,725 | 20,682 | 20,632 | 20,589 | 20,552 |
| ADP:Information(Thousands) | 2,845 | 2,847 | 2,845 | 2,846 | 2,848 |
| ADP:Leisure & hospitality(Thousands) | 16,858 | 16,814 | 16,766 | 16,736 | 16,715 |
| ADP:Management of companies(Thousands) | 2,438 | 2,437 | 2,434 | 2,431 | 2,428 |
| ADP:Manufacturing(Thousands) | 12,786 | 12,789 | 12,793 | 12,794 | 12,756 |
| ADP:Natural resources & mining(Thousands) | 725 | 728 | 732 | 733 | 734 |
| ADP:Other services(Thousands) | 5,915 | 5,908 | 5,900 | 5,893 | 5,888 |
| ADP:Prof.l/business services(Thousands) | 21,564 | 21,526 | 21,497 | 21,454 | 21,423 |
| ADP:Professional services(Thousands) | 9,652 | 9,640 | 9,620 | 9,595 | 9,574 |
| ADP:Service providing(Thousands) | 108,413.4 | 108,241.6 | 108,055 | 107,904.3 | 107,781.2 |
| ADP:Total private(Thousands) | 129,476.5 | 129,293.7 | 129,084.8 | 128,917.7 | 128,757 |
| ADP:Trade/transp./utilities(Thousands) | 27,897 | 27,866 | 27,830 | 27,817 | 27,799 |
ケース・シラー住宅価格指数
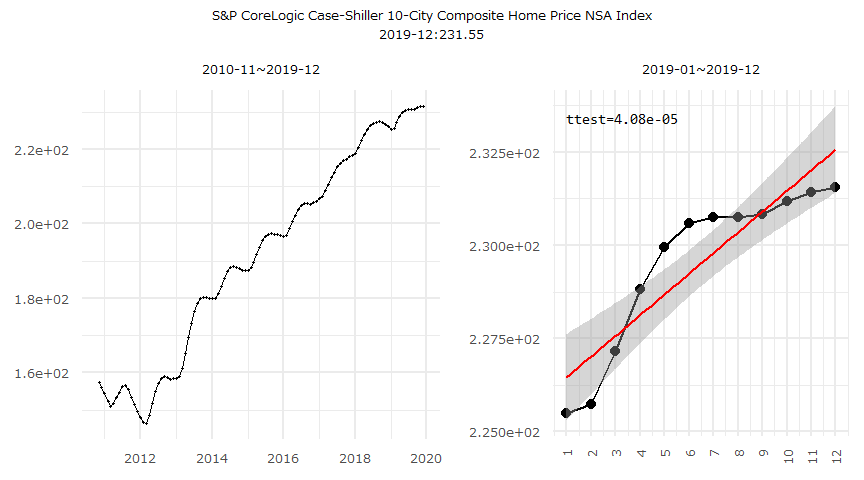


| Date | 2019-12 | 2019-11 | 2019-10 | 2019-09 | 2019-08 |
|---|---|---|---|---|---|
| S&P CoreLogic Case-Shiller 10-City Composite Home Price NSA Index | 231.55 | 231.43 | 231.18 | 230.84 | 230.76 |
| S&P CoreLogic Case-Shiller 20-City Composite Home Price NSA Index | 218.73 | 218.65 | 218.44 | 218.22 | 218.09 |
| S&P CoreLogic Case-Shiller U.S. National Home Price NSA Index | 212.59 | 212.42 | 212.2 | 212.14 | 211.97 |
外国籍保有米国債:Foreign Holders of U.S. Treasury Securities
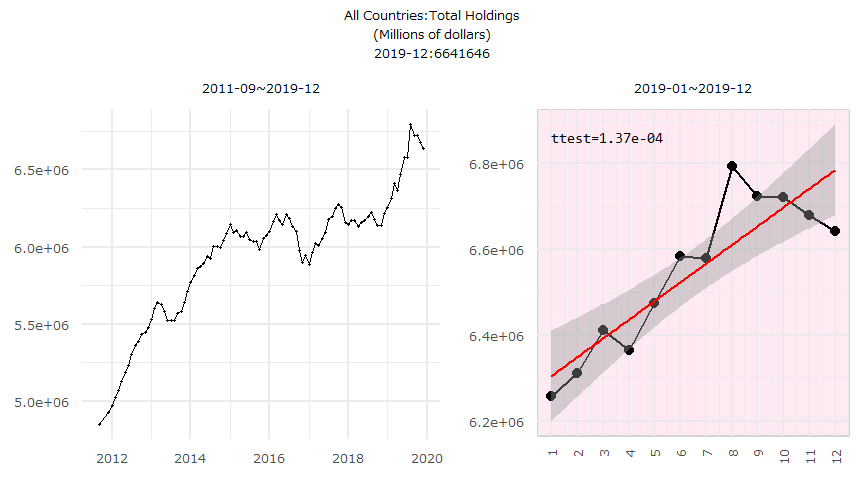
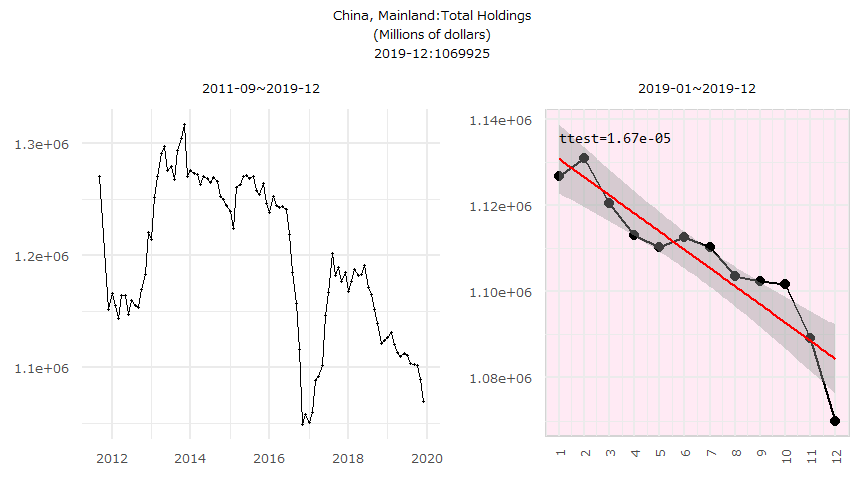
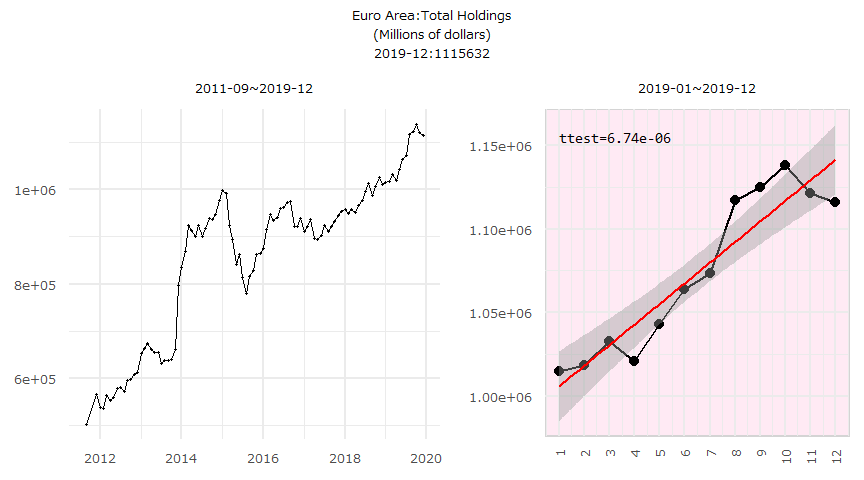
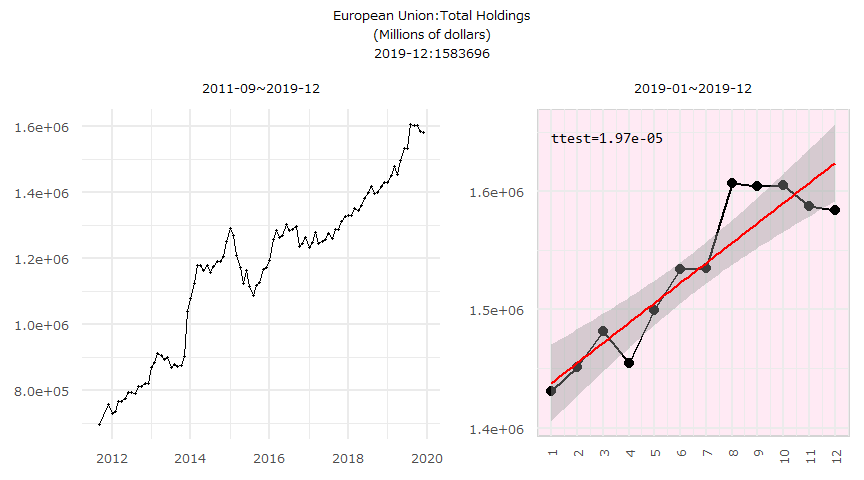


| Date | 2019-12 | 2019-11 | 2019-10 | 2019-09 | 2019-08 |
|---|---|---|---|---|---|
| All Countries:Total Holdings(Millions of dollars) | 6,641,646 | 6,679,545 | 6,720,550 | 6,722,598 | 6,793,161 |
| China, Mainland:Total Holdings(Millions of dollars) | 1,069,925 | 1,089,197 | 1,101,603 | 1,102,434 | 1,103,526 |
| Euro Area:Total Holdings(Millions of dollars) | 1,115,632 | 1,121,482 | 1,138,251 | 1,124,661 | 1,117,099 |
| European Union:Total Holdings(Millions of dollars) | 1,583,696 | 1,587,030 | 1,604,646 | 1,604,163 | 1,606,362 |
| Grand Total:Total Holdings(Millions of dollars) | 6,696,269 | 6,740,269 | 6,779,568 | 6,777,844 | 6,856,707 |
| Japan:Total Holdings(Millions of dollars) | 1,154,901 | 1,160,842 | 1,168,017 | 1,145,797 | 1,174,686 |
建設許可件数[年率換算件数]


| Date | 2020-01 | 2019-12 | 2019-11 | 2019-10 | 2019-09 |
|---|---|---|---|---|---|
| New Private Housing Units Authorized by Building Permits - in Structures with 1 Unit(Thousands of Units,Seasonally Adjusted Annual Rate) | 987 | 928 | 921 | 911 | 881 |
| New Private Housing Units Authorized by Building Permits(Thousands of Units,Seasonally Adjusted Annual Rate) | 1,550 | 1,420 | 1,474 | 1,461 | 1,391 |
鉱工業生産
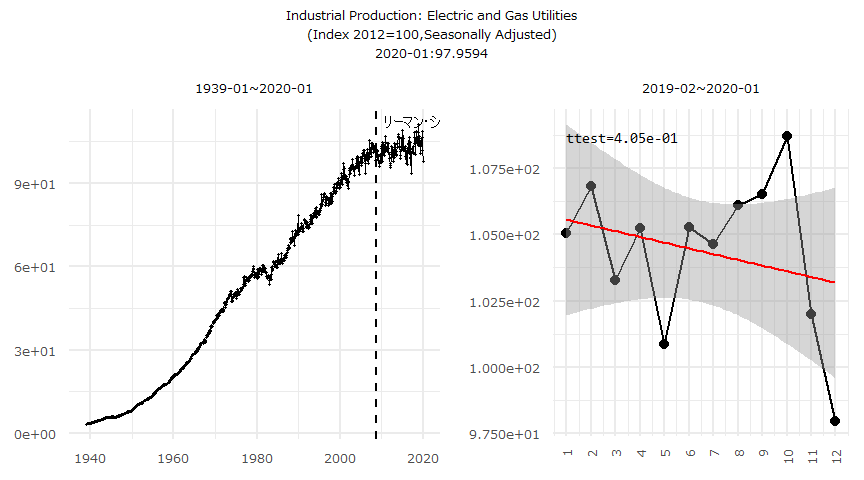


| Date | 2020-01 | 2019-12 | 2019-11 | 2019-10 | 2019-09 |
|---|---|---|---|---|---|
| Industrial Production: Electric and Gas Utilities(Index 2012=100,Seasonally Adjusted) | 97.9594 | 101.9947 | 108.7234 | 106.5358 | 106.1079 |
| Industrial Production: Manufacturing(Index 2012=100,Seasonally Adjusted) | 106.11 | 106.2074 | 106.1436 | 105.0501 | 105.6543 |
| Industrial Production Index(Index 2012=100,Seasonally Adjusted) | 109.2026 | 109.5407 | 109.9726 | 109.0086 | 109.48 |
国内総生産


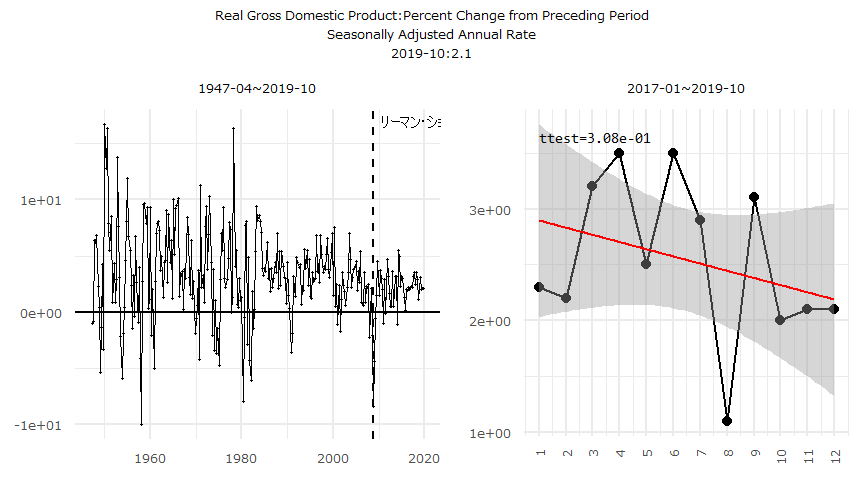
| Date | 2019-10 | 2019-07 | 2019-04 | 2019-01 | 2018-10 |
|---|---|---|---|---|---|
| Gross Domestic Product:Billions of Dollars,Seasonally Adjusted Annual Rate | 21,726.78 | 21,542.54 | 21,340.27 | 21,098.83 | 20,897.8 |
| Gross Domestic Product:Percent Change from Preceding Period,Seasonally Adjusted Annual Rate | 3.5 | 3.8 | 4.7 | 3.9 | 2.9 |
| Real Gross Domestic Product:Billions of Chained 2012 Dollars,Seasonally Adjusted Annual Rate | 19,220.49 | 19,121.11 | 19,021.86 | 18,927.28 | 18,783.55 |
| Real Gross Domestic Product:Percent Change from Preceding Period,Seasonally Adjusted Annual Rate | 2.1 | 2.1 | 2 | 3.1 | 1.1 |
住宅価格指数:House Price Indexes


| Date | 2019-12 | 2019-11 | 2019-10 | 2019-09 | 2019-08 |
|---|---|---|---|---|---|
| traditional:purchase-only:USA or Census Division:United States:NSA | 282.44 | 282.52 | 282.38 | 282.85 | 281.94 |
| traditional:purchase-only:USA or Census Division:United States:SA | 283 | 281.28 | 280.51 | 279.54 | 277.38 |
住宅着工件数

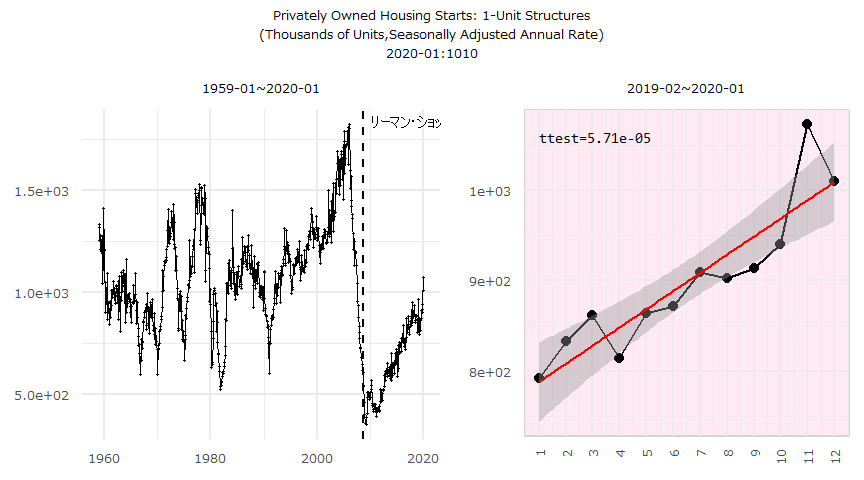
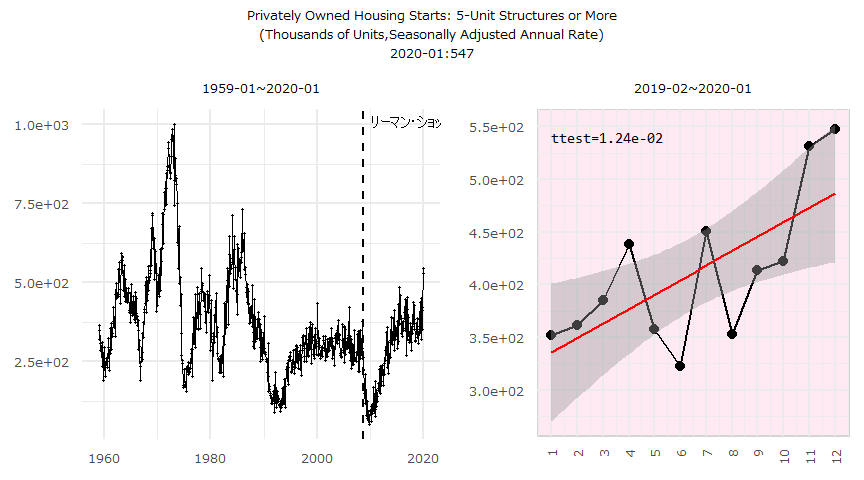
| Date | 2020-01 | 2019-12 | 2019-11 | 2019-10 | 2019-09 |
|---|---|---|---|---|---|
| Housing Starts: Total: New Privately Owned Housing Units Started(Thousands of Units,Seasonally Adjusted Annual Rate) | 1,567 | 1,626 | 1,381 | 1,340 | 1,266 |
| Privately Owned Housing Starts: 1-Unit Structures(Thousands of Units,Seasonally Adjusted Annual Rate) | 1,010 | 1,073 | 940 | 914 | 902 |
| Privately Owned Housing Starts: 5-Unit Structures or More(Thousands of Units,Seasonally Adjusted Annual Rate) | 547 | 531 | 422 | 414 | 353 |
小売売上高:Advance Retail Sales


| Date | 2020-01 | 2019-12 | 2019-11 | 2019-10 | 2019-09 |
|---|---|---|---|---|---|
| Retail and Food Services Excluding Motor Vehicles and Parts Dealers(Millions of Dollars,Seasonally Adjusted) | 423,282 | 422,060 | 419,404 | 420,038 | 419,405 |
| Retail and Food Services, Total(Millions of Dollars,Seasonally Adjusted) | 529,766 | 528,367 | 527,518 | 526,420 | 524,651 |
| Retail(Millions of Dollars,Seasonally Adjusted) | 463,226 | 462,598 | 462,513 | 461,047 | 459,191 |
消費者信用残高
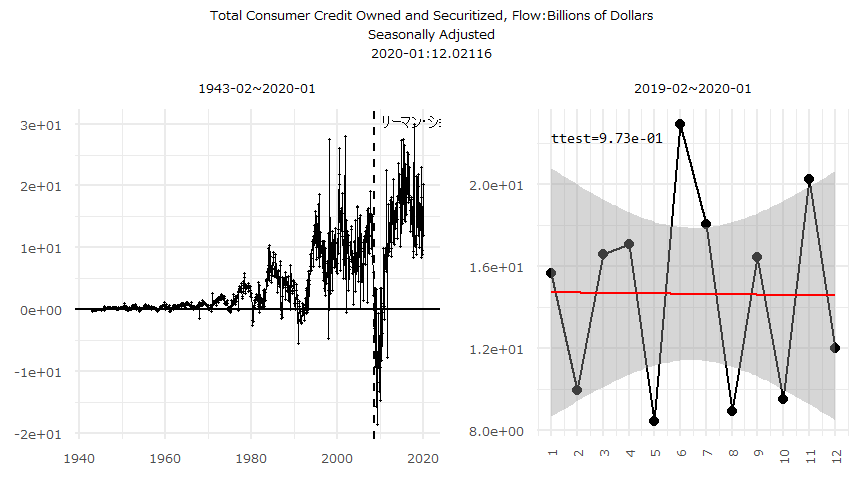
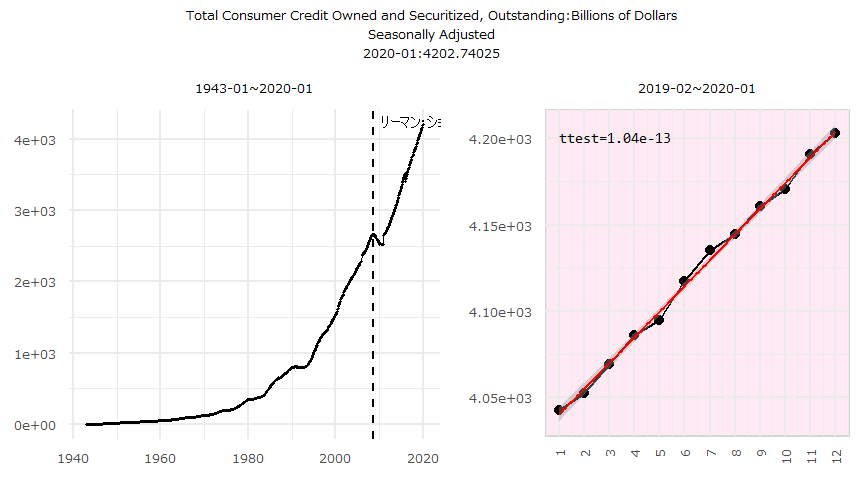
| Date | 2020-01 | 2019-12 | 2019-11 | 2019-10 | 2019-09 |
|---|---|---|---|---|---|
| Total Consumer Credit Owned and Securitized, Flow:Billions of Dollars,Seasonally Adjusted | 12.02116 | 20.25106 | 9.51296 | 16.435 | 8.92573 |
| Total Consumer Credit Owned and Securitized, Outstanding:Billions of Dollars,Seasonally Adjusted | 4,202.74 | 4,190.719 | 4,170.468 | 4,160.955 | 4,144.52 |
消費者物価指数:Consumer Price Index for All Urban Consumers
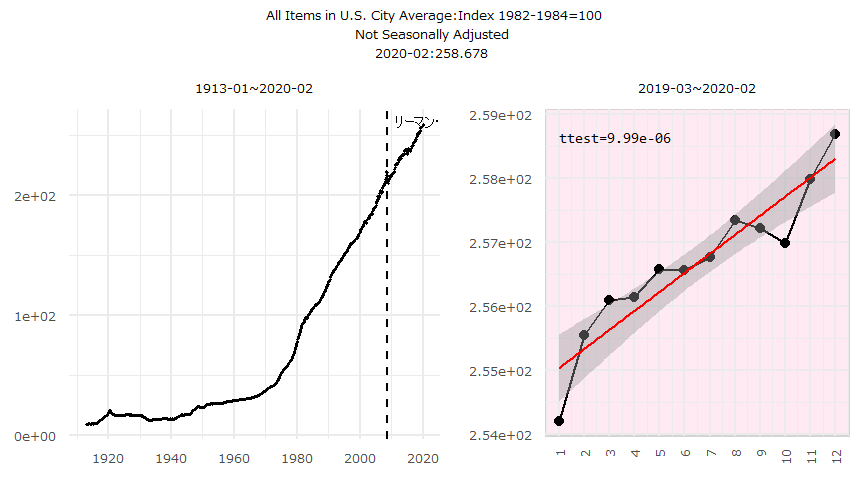
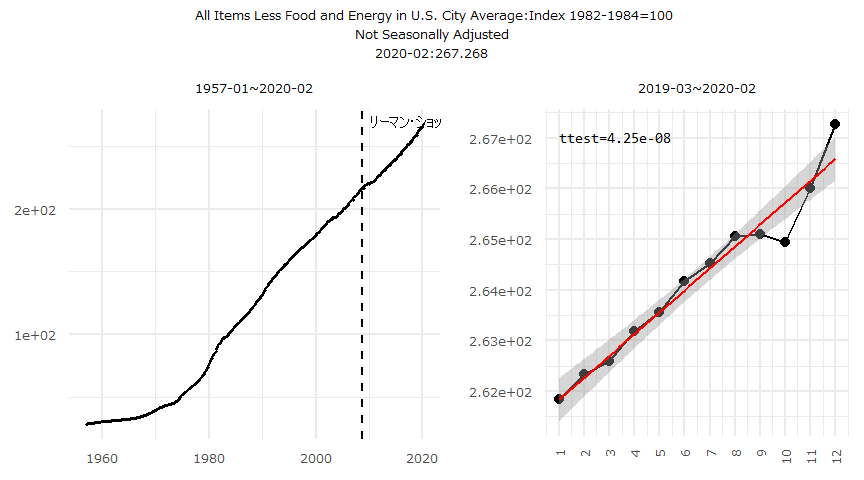
| Date | 2020-02 | 2020-01 | 2019-12 | 2019-11 | 2019-10 |
|---|---|---|---|---|---|
| All Items in U.S. City Average:Index 1982-1984=100,Not Seasonally Adjusted | 258.678 | 257.971 | 256.974 | 257.208 | 257.346 |
| All Items Less Food and Energy in U.S. City Average:Index 1982-1984=100,Not Seasonally Adjusted | 267.268 | 266.004 | 264.935 | 265.108 | 265.059 |
新築住宅販売件数[年率換算件数,千件]:Annual Rate for New Single-family Houses Sold

| Date | 2020-01 | 2019-12 | 2019-11 | 2019-10 | 2019-09 |
|---|---|---|---|---|---|
| United StatesSeasonally Adjusted All Houses [Thousands of Units] | 764 | 708 | 692 | 707 | 725 |
デフォルト率

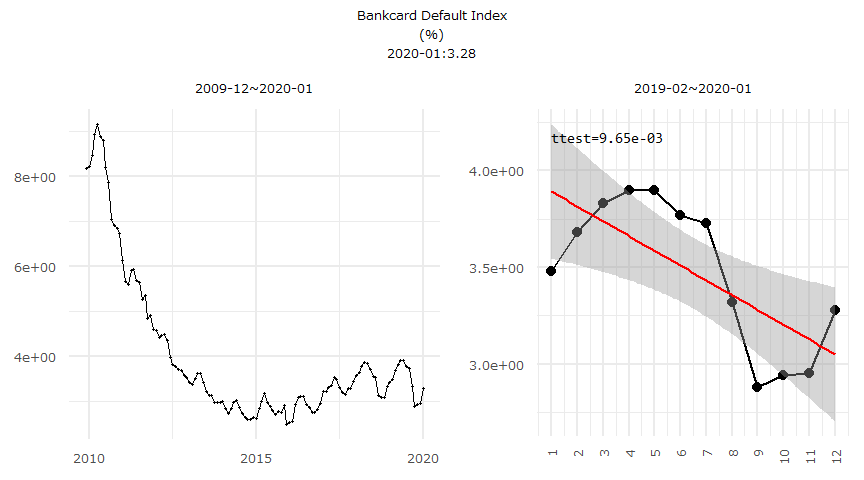

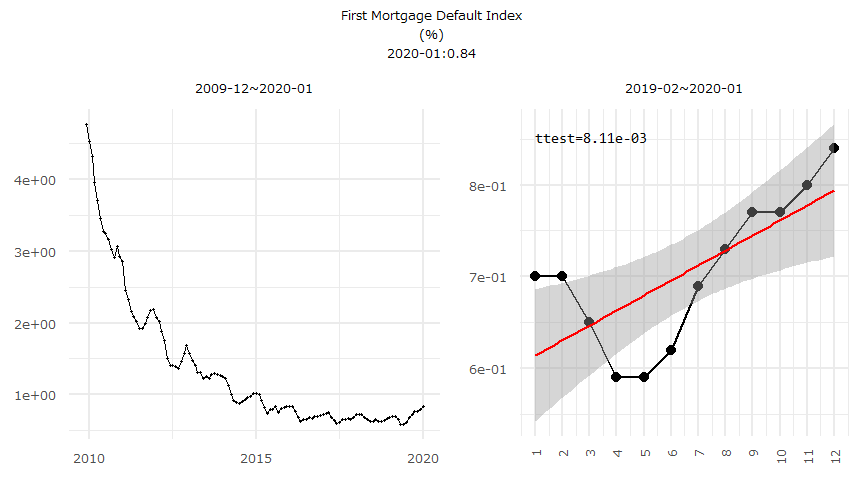
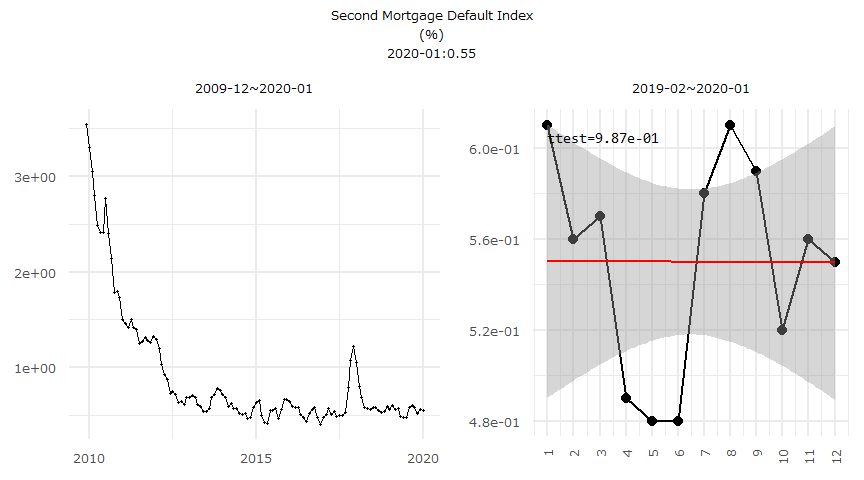
| Date | 2020-01 | 2019-12 | 2019-11 | 2019-10 | 2019-09 |
|---|---|---|---|---|---|
| Auto Default Index(%) | 0.99 | 1.02 | 1.02 | 1.03 | 1.05 |
| Bankcard Default Index(%) | 3.28 | 2.95 | 2.94 | 2.88 | 3.32 |
| Consumer Credit Default Composite Index(%) | 1.02 | 0.96 | 0.94 | 0.93 | 0.93 |
| First Mortgage Default Index(%) | 0.84 | 0.8 | 0.77 | 0.77 | 0.73 |
| Second Mortgage Default Index(%) | 0.55 | 0.56 | 0.52 | 0.59 | 0.61 |
倒産件数


| Date | 2020-01 | 2019-12 | 2019-11 | 2019-10 | 2019-09 |
|---|---|---|---|---|---|
| Chapter 11:Total Filings | 630 | 391 | 449 | 530 | 417 |
| Chapter 13:Total Filings | 920 | 732 | 773 | 884 | 803 |
| Chapter 15:Total Filings | 4 | 10 | 11 | 5 | 8 |
| Chapter 7:Total Filings | 1,924 | 1,731 | 1,761 | 2,124 | 1,929 |
| Commercial Totals:Business Filings Per Day | 167 | 138 | 159 | 162 | 159 |
| Commercial Totals:Filing Days | 21 | 21 | 19 | 22 | 20 |
| Commercial Totals:Total Filings | 3,500 | 2,895 | 3,016 | 3,569 | 3,185 |
不履行率
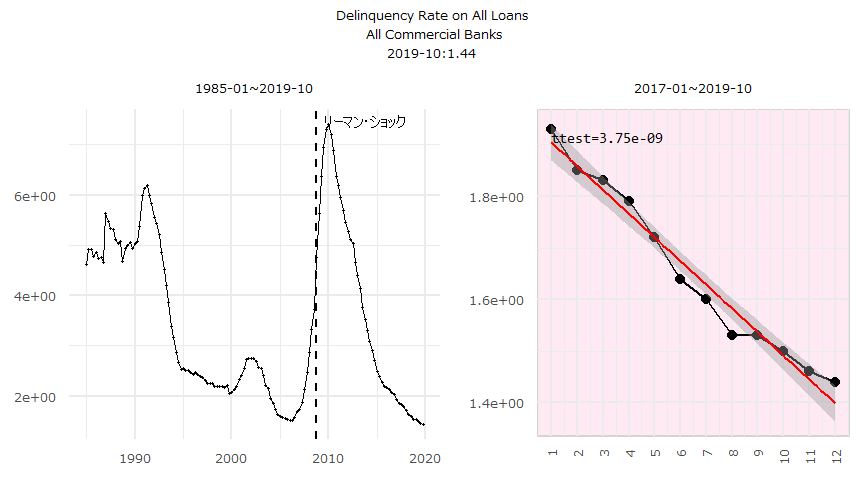


| Date | 2019-10 | 2019-07 | 2019-04 | 2019-01 | 2018-10 |
|---|---|---|---|---|---|
| Delinquency Rate on All Loans, All Commercial Banks | 1.44 | 1.46 | 1.5 | 1.53 | 1.53 |
| Delinquency Rate on Commercial and Industrial Loans, All Commercial Banks | 1.14 | 1.13 | 1.06 | 1.13 | 0.96 |
| Delinquency Rate on Consumer Loans, All Commercial Banks | 2.34 | 2.32 | 2.34 | 2.34 | 2.33 |
| Delinquency Rate on Credit Card Loans, All Commercial Banks | 2.61 | 2.58 | 2.57 | 2.58 | 2.54 |
| Delinquency Rate on Single-Family Residential Mortgages, Booked in Domestic Offices, All Commercial Banks | 2.35 | 2.46 | 2.59 | 2.69 | 2.83 |
ISM


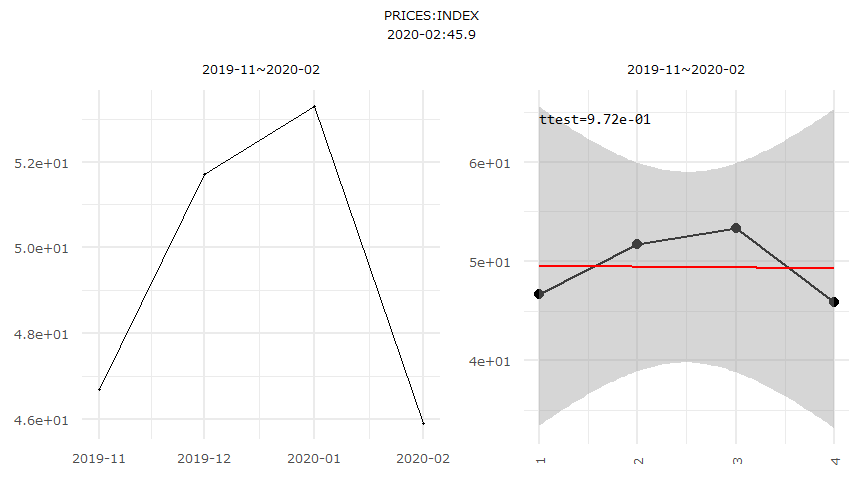
| Date | 2020-02 | 2020-01 | 2019-12 | 2019-11 | 2019-10 |
|---|---|---|---|---|---|
| EMPLOYMENT:INDEX | 46.9 | 46.6 | 45.2 | 46.8 | NA |
| NEWORD:INDEX | 49.8 | 52 | 47.6 | 46.8 | NA |
| PMI | 50.1 | 50.9 | 47.8 | 48.1 | 48.5 |
| PRICES:INDEX | 45.9 | 53.3 | 51.7 | 46.7 | NA |
ファンダメンタルズ