世界各国の経済社会指標分析
- 経済指標間の相関、人口増加率と経済指標との相関、世界各国の軍事費、武器販売額、世界貿易モニター、世界各国の自動車生産台数、Economic Policy Uncertainty -
アセット・マネジメント・コンサルティング株式会社 https://am-consulting.co.jp
更新日時:2019-11-28 06:52:13
Analysis
| 指標1 | 指標2 | 相関係数 | 傾き | 傾き信頼区間(下限) | 傾き信頼区間(上限) |
|---|---|---|---|---|---|
| Gross domestic product per capita, constant prices(Purchasing power parity; 2011 international dollar):2017:IMF | Gross domestic product per capita, current prices(Purchasing power parity; international dollars):2017:IMF | 1 | 1.1 | 1.1 | 1.1 |
| General government revenue(Percent of GDP):2017:IMF | General government total expenditure(Percent of GDP):2017:IMF | 0.925 | 0.847 | 0.796 | 0.898 |
| Contraceptive prevalence, any methods (% of women ages 15-49):2017:WBG | School enrollment, secondary (% gross):2017:WBG | 0.879 | 1.06 | 0.658 | 1.47 |
| Inflation, end of period consumer prices(Percent change):2017:IMF | Inflation, consumer prices (annual %):2017:WBG | 0.875 | 0.84 | 0.764 | 0.916 |
| General government revenue(Percent of GDP):2017:IMF | Revenue, excluding grants (% of GDP):2017:WBG | 0.82 | 0.719 | 0.628 | 0.81 |
| General government net lending/borrowing(Percent of GDP):2017:IMF | General government primary net lending/borrowing(Percent of GDP):2017:IMF | 0.808 | 0.75 | 0.667 | 0.833 |
| Gross domestic product per capita, constant prices(Purchasing power parity; 2011 international dollar):2017:IMF | Contraceptive prevalence, any methods (% of women ages 15-49):2017:WBG | 0.782 | 0.00378 | 0.00224 | 0.00533 |
| Gross domestic product per capita, current prices(Purchasing power parity; international dollars):2017:IMF | Contraceptive prevalence, any methods (% of women ages 15-49):2017:WBG | 0.782 | 0.00344 | 0.00204 | 0.00484 |
| General government total expenditure(Percent of GDP):2017:IMF | Revenue, excluding grants (% of GDP):2017:WBG | 0.776 | 0.738 | 0.629 | 0.847 |
| GNI per capita, Atlas method (current US dollar):2017:WBG | Contraceptive prevalence, any methods (% of women ages 15-49):2017:WBG | 0.756 | 0.00849 | 0.00473 | 0.0122 |
| Primary completion rate, total (% of relevant age group):2017:WBG | School enrollment, secondary (% gross):2017:WBG | 0.746 | 1.21 | 0.939 | 1.49 |
| Gross domestic product per capita, constant prices(Purchasing power parity; 2011 international dollar):2017:IMF | School enrollment, secondary (% gross):2017:WBG | 0.739 | 0.00235 | 0.00183 | 0.00286 |
| Gross domestic product per capita, current prices(Purchasing power parity; international dollars):2017:IMF | School enrollment, secondary (% gross):2017:WBG | 0.739 | 0.00213 | 0.00166 | 0.0026 |
| GNI per capita, PPP (current international dollar):2017:WBG | School enrollment, secondary (% gross):2017:WBG | 0.71 | 0.0019 | 0.00145 | 0.00236 |
| Gross domestic product based on purchasing-power-parity (PPP) share of world total(Percent):2017:IMF | Contraceptive prevalence, any methods (% of women ages 15-49):2017:WBG | 0.706 | 153 | 68.5 | 237 |
| Gross domestic product per capita, current prices(U.S. dollars):2017:IMF | Contraceptive prevalence, any methods (% of women ages 15-49):2017:WBG | 0.705 | 0.00851 | 0.00397 | 0.013 |
| Contraceptive prevalence, any methods (% of women ages 15-49):2017:WBG | GDP per capita (current US dollar):2017:WBG | 0.695 | 57.6 | 26 | 89.1 |
| Contraceptive prevalence, any methods (% of women ages 15-49):2017:WBG | Industry (including construction), value added (% of GDP):2017:WBG | 0.691 | 0.278 | 0.129 | 0.427 |
| Exports of goods and services (% of GDP):2017:WBG | Merchandise trade (% of GDP):2017:WBG | 0.672 | 0.961 | 0.791 | 1.13 |
| GNI per capita, Atlas method (current US dollar):2017:WBG | School enrollment, secondary (% gross):2017:WBG | 0.671 | 0.00418 | 0.00305 | 0.0053 |
| GNI per capita, PPP (current international dollar):2017:WBG | Contraceptive prevalence, any methods (% of women ages 15-49):2017:WBG | 0.671 | 0.00256 | 0.0012 | 0.00392 |
| School enrollment, secondary (% gross):2017:WBG | GDP per capita (current US dollar):2017:WBG | 0.67 | 116 | 84.6 | 147 |
| General government structural balance(Percent of potential GDP):2017:IMF | General government primary net lending/borrowing(Percent of GDP):2017:IMF | 0.667 | 0.561 | 0.414 | 0.707 |
| Gross domestic product per capita, current prices(U.S. dollars):2017:IMF | School enrollment, secondary (% gross):2017:WBG | 0.663 | 0.00372 | 0.00271 | 0.00474 |
| Imports of goods and services (% of GDP):2017:WBG | Merchandise trade (% of GDP):2017:WBG | 0.663 | 0.862 | 0.707 | 1.02 |
| Exports of goods and services (% of GDP):2017:WBG | Imports of goods and services (% of GDP):2017:WBG | 0.657 | 0.646 | 0.532 | 0.761 |
| Total investment(Percent of GDP):2017:IMF | Gross national savings(Percent of GDP):2017:IMF | 0.624 | 0.79 | 0.632 | 0.948 |
| Gross domestic product per capita, constant prices(Purchasing power parity; 2011 international dollar):2017:IMF | High-technology exports (% of manufactured exports):2017:WBG | 0.563 | 0.000219 | 0.000161 | 0.000277 |
| Gross domestic product per capita, current prices(Purchasing power parity; international dollars):2017:IMF | High-technology exports (% of manufactured exports):2017:WBG | 0.563 | 0.000199 | 0.000146 | 0.000251 |
| Gross domestic product per capita, current prices(U.S. dollars):2017:IMF | High-technology exports (% of manufactured exports):2017:WBG | 0.561 | 0.00027 | 0.000193 | 0.000347 |
| 指標1 | 指標2 | 相関係数 | 傾き | 傾き信頼区間(下限) | 傾き信頼区間(上限) |
|---|---|---|---|---|---|
| Population growth (annual %):2017:WBG | Contraceptive prevalence, any methods (% of women ages 15-49):2017:WBG | -0.75 | -14.8 | -21.1 | -8.54 |
| School enrollment, secondary (% gross):2017:WBG | Agriculture, forestry, and fishing, value added (% of GDP):2017:WBG | -0.735 | -0.281 | -0.342 | -0.22 |
| Gross domestic product per capita, current prices(Purchasing power parity; international dollars):2017:IMF | Agriculture, forestry, and fishing, value added (% of GDP):2017:WBG | -0.705 | -0.000399 | -0.000464 | -0.000335 |
| Gross domestic product per capita, constant prices(Purchasing power parity; 2011 international dollar):2017:IMF | Agriculture, forestry, and fishing, value added (% of GDP):2017:WBG | -0.705 | -0.000439 | -0.00051 | -0.000368 |
| Contraceptive prevalence, any methods (% of women ages 15-49):2017:WBG | Net ODA received per capita (current US dollar):2017:WBG | -0.63 | -0.903 | -1.44 | -0.368 |
| Population growth (annual %):2017:WBG | School enrollment, secondary (% gross):2017:WBG | -0.582 | -15.6 | -20.6 | -10.7 |
| Contraceptive prevalence, any methods (% of women ages 15-49):2017:WBG | Prevalence of HIV, total (% of population ages 15-49):2017:WBG | -0.535 | -0.0242 | -0.0453 | -0.00315 |
| Contraceptive prevalence, any methods (% of women ages 15-49):2017:WBG | Agriculture, forestry, and fishing, value added (% of GDP):2017:WBG | -0.493 | -0.227 | -0.439 | -0.0144 |
| Gross domestic product based on purchasing-power-parity (PPP) share of world total(Percent):2017:IMF | Net ODA received per capita (current US dollar):2017:WBG | -0.487 | -343 | -469 | -218 |
| Agriculture, forestry, and fishing, value added (% of GDP):2017:WBG | Exports of goods and services (% of GDP):2017:WBG | -0.478 | -0.98 | -1.28 | -0.682 |
| Primary completion rate, total (% of relevant age group):2017:WBG | Market capitalization of listed domestic companies (% of GDP):2017:WBG | -0.477 | -3.53 | -6.66 | -0.409 |
| General government revenue(Percent of GDP):2017:IMF | Agriculture, forestry, and fishing, value added (% of GDP):2017:WBG | -0.476 | -0.39 | -0.504 | -0.275 |
| Poverty headcount ratio at national poverty lines (% of population):2017:WBG | Inflation, consumer prices (annual %):2017:WBG | -0.468 | -0.0873 | -0.166 | -0.00804 |
| Population growth (annual %):2017:WBG | Total debt service (% of GNI):2017:WBG | -0.464 | -1.35 | -1.84 | -0.864 |
| Population growth (annual %):2017:WBG | Revenue, excluding grants (% of GDP):2017:WBG | -0.464 | -4.05 | -5.43 | -2.67 |
| Poverty headcount ratio at national poverty lines (% of population):2017:WBG | Industry (including construction), value added (% of GDP):2017:WBG | -0.453 | -0.311 | -0.581 | -0.0401 |
| Unemployment rate(Percent of total labor force):2017:IMF | Current account balance(Percent of GDP):2017:IMF | -0.452 | -0.626 | -0.878 | -0.373 |
| Population growth (annual %):2017:WBG | Primary completion rate, total (% of relevant age group):2017:WBG | -0.442 | -6.18 | -9.11 | -3.25 |
| General government total expenditure(Percent of GDP):2017:IMF | Agriculture, forestry, and fishing, value added (% of GDP):2017:WBG | -0.439 | -0.372 | -0.492 | -0.252 |
| Poverty headcount ratio at national poverty lines (% of population):2017:WBG | Inflation, GDP deflator (annual %):2017:WBG | -0.432 | -0.0945 | -0.186 | -0.00253 |
| General government revenue(Percent of GDP):2017:IMF | Population growth (annual %):2017:WBG | -0.432 | -0.0451 | -0.0588 | -0.0313 |
| Output gap in percent of potential GDP(Percent of potential GDP):2017:IMF | General government gross debt(Percent of GDP):2017:IMF | -0.425 | -16.4 | -31.4 | -1.34 |
| Agriculture, forestry, and fishing, value added (% of GDP):2017:WBG | Total debt service (% of GNI):2017:WBG | -0.424 | -0.136 | -0.194 | -0.0783 |
| Poverty headcount ratio at national poverty lines (% of population):2017:WBG | GNI per capita, PPP (current international dollar):2017:WBG | -0.418 | -254 | -499 | -9.67 |
| Inflation, average consumer prices(Percent change):2017:IMF | Poverty headcount ratio at national poverty lines (% of population):2017:WBG | -0.418 | -1.59 | -3.16 | -0.0223 |
| Gross domestic product per capita, current prices(Purchasing power parity; international dollars):2017:IMF | Poverty headcount ratio at national poverty lines (% of population):2017:WBG | -0.415 | -0.000593 | -0.00115 | -0.0000325 |
| Gross domestic product per capita, constant prices(Purchasing power parity; 2011 international dollar):2017:IMF | Poverty headcount ratio at national poverty lines (% of population):2017:WBG | -0.415 | -0.000653 | -0.00127 | -0.0000358 |
| General government net debt(Percent of GDP):2017:IMF | Inflation, GDP deflator (annual %):2017:WBG | -0.411 | -0.028 | -0.0426 | -0.0135 |
| Agriculture, forestry, and fishing, value added (% of GDP):2017:WBG | Revenue, excluding grants (% of GDP):2017:WBG | -0.406 | -0.556 | -0.8 | -0.311 |
| Current account balance(Percent of GDP):2017:IMF | Net ODA received per capita (current US dollar):2017:WBG | -0.404 | -3.38 | -4.87 | -1.9 |
人口増加率との相関
- Population growth (annual %):2017:WBGとの相関を確認。
- 分析設計
- 上記「経済指標同士の相関」と1~9までは同一。
- 線形回帰係数、正規性検定のp値をグループ分けして結果を表示しています。
- 以下、注意してください。
- 交絡因子、同時性は考慮していません。
- IMFデータとWBGデータの重複は考慮していません。
- Data source:IMF、WBG
| 指標1 | 指標2 | 相関係数 | 傾き | 傾きp値 | 傾き信頼区間(下限) | 傾き信頼区間(上限) | 正規性検定p値 |
|---|---|---|---|---|---|---|---|
| Population growth (annual %):2017:WBG | Poverty headcount ratio at national poverty lines (% of population):2017:WBG | 0.4 | 5.28 | 0.0474 | 0.066 | 10.5 | 0.68 |
| Population growth (annual %):2017:WBG | Agriculture, forestry, and fishing, value added (% of GDP):2017:WBG | 0.38 | 2.97 | 0.0000003 | 1.87 | 4.08 | 0.0768 |
| Population growth (annual %):2017:WBG | Inflation, GDP deflator (annual %):2017:WBG | 0.279 | 0.794 | 0.000136 | 0.392 | 1.2 | 0.108 |
| Population growth (annual %):2017:WBG | Volume of imports of goods and services(Percent change):2017:IMF | -0.163 | -0.87 | 0.0395 | -1.7 | -0.0423 | 0.624 |
| Population growth (annual %):2017:WBG | Merchandise trade (% of GDP):2017:WBG | -0.207 | -4.44 | 0.00559 | -7.55 | -1.32 | 0.302 |
| Population growth (annual %):2017:WBG | Imports of goods and services (% of GDP):2017:WBG | -0.225 | -3.97 | 0.0029 | -6.57 | -1.38 | 0.204 |
| Population growth (annual %):2017:WBG | Volume of exports of goods and services(Percent change):2017:IMF | -0.241 | -1.3 | 0.00225 | -2.13 | -0.474 | 0.491 |
| Population growth (annual %):2017:WBG | Current account balance(Percent of GDP):2017:IMF | -0.261 | -1.39 | 0.000423 | -2.15 | -0.627 | 0.622 |
| Population growth (annual %):2017:WBG | Exports of goods and services (% of GDP):2017:WBG | -0.29 | -4.75 | 0.000135 | -7.15 | -2.35 | 0.122 |
| Population growth (annual %):2017:WBG | General government net lending/borrowing(Percent of GDP):2017:IMF | -0.344 | -0.977 | 0.0000028 | -1.38 | -0.579 | 0.964 |
| Population growth (annual %):2017:WBG | General government primary net lending/borrowing(Percent of GDP):2017:IMF | -0.359 | -0.905 | 0.0000014 | -1.26 | -0.548 | 0.71 |
| Population growth (annual %):2017:WBG | General government total expenditure(Percent of GDP):2017:IMF | -0.373 | -3.21 | 0.0000002 | -4.39 | -2.04 | 0.762 |
| Population growth (annual %):2017:WBG | General government revenue(Percent of GDP):2017:IMF | -0.432 | -4.15 | 0 | -5.41 | -2.88 | 0.331 |
| Population growth (annual %):2017:WBG | Primary completion rate, total (% of relevant age group):2017:WBG | -0.442 | -6.18 | 0.0000729 | -9.11 | -3.25 | 0.844 |
| Population growth (annual %):2017:WBG | Revenue, excluding grants (% of GDP):2017:WBG | -0.464 | -4.05 | 0.0000001 | -5.43 | -2.67 | 0.744 |
| Population growth (annual %):2017:WBG | Total debt service (% of GNI):2017:WBG | -0.464 | -1.35 | 0.0000003 | -1.84 | -0.864 | 0.0653 |
| Population growth (annual %):2017:WBG | School enrollment, secondary (% gross):2017:WBG | -0.582 | -15.6 | 0 | -20.6 | -10.7 | 0.969 |
| Population growth (annual %):2017:WBG | Contraceptive prevalence, any methods (% of women ages 15-49):2017:WBG | -0.75 | -14.8 | 0.0000916 | -21.1 | -8.54 | 0.965 |
| 指標1 | 指標2 | 相関係数 | 傾き | 傾きp値 | 傾き信頼区間(下限) | 傾き信頼区間(上限) | 正規性検定p値 |
|---|---|---|---|---|---|---|---|
| Population growth (annual %):2017:WBG | Prevalence of HIV, total (% of population ages 15-49):2017:WBG | 0.276 | 0.171 | 0.00247 | 0.0616 | 0.281 | 0.000749 |
| Population growth (annual %):2017:WBG | Gross domestic product per capita, current prices(National currency):2017:IMF | 0.261 | 50,600 | 0.000944 | 20,900 | 80,200 | 0.0000001 |
| Population growth (annual %):2017:WBG | Immunization, measles (% of children ages 12-23 months):2017:WBG | -0.237 | -1.62 | 0.00167 | -2.62 | -0.619 | 0.0131 |
| Population growth (annual %):2017:WBG | Gross domestic product per capita, constant prices(Purchasing power parity; 2011 international dollar):2017:IMF | -0.296 | -3,740 | 0.0000562 | -5,530 | -1,950 | 0.0000028 |
| Population growth (annual %):2017:WBG | Gross domestic product per capita, current prices(Purchasing power parity; international dollars):2017:IMF | -0.296 | -4,120 | 0.0000562 | -6,080 | -2,150 | 0.0000028 |
| Population growth (annual %):2017:WBG | Gross domestic product per capita, current prices(U.S. dollars):2017:IMF | -0.33 | -2,300 | 0.0000157 | -3,320 | -1,280 | 0.0000012 |
| Population growth (annual %):2017:WBG | High-technology exports (% of manufactured exports):2017:WBG | -0.349 | -2.02 | 0.0000497 | -2.97 | -1.07 | 0.0195 |
| Population growth (annual %):2017:WBG | GNI per capita, Atlas method (current US dollar):2017:WBG | -0.36 | -2,280 | 0.0000022 | -3,190 | -1,360 | 0.0000007 |
| Population growth (annual %):2017:WBG | GNI per capita, PPP (current international dollar):2017:WBG | -0.366 | -4,980 | 0.0000005 | -6,860 | -3,100 | 0.0000025 |
| Population growth (annual %):2017:WBG | GDP per capita (current US dollar):2017:WBG | -0.382 | -3,520 | 0.0000002 | -4,790 | -2,250 | 0 |
| 指標1 | 指標2 | 相関係数 | 傾き | 傾きp値 | 傾き信頼区間(下限) | 傾き信頼区間(上限) | 正規性検定p値 |
|---|---|---|---|---|---|---|---|
| Population growth (annual %):2017:WBG | GDP growth (annual %):2017:WBG | 0.145 | 0.283 | 0.0505 | -0.000614 | 0.566 | 0.767 |
| Population growth (annual %):2017:WBG | Output gap in percent of potential GDP(Percent of potential GDP):2017:IMF | 0.127 | 0.154 | 0.545 | -0.366 | 0.675 | 0.935 |
| Population growth (annual %):2017:WBG | Total investment(Percent of GDP):2017:IMF | 0.118 | 0.671 | 0.137 | -0.215 | 1.56 | 0.686 |
| Population growth (annual %):2017:WBG | Gross domestic product, constant prices(Percent change):2017:IMF | 0.102 | 0.2 | 0.182 | -0.0944 | 0.494 | 0.889 |
| Population growth (annual %):2017:WBG | Industry (including construction), value added (% of GDP):2017:WBG | 0.0837 | 0.702 | 0.278 | -0.572 | 1.98 | 0.818 |
| Population growth (annual %):2017:WBG | Gross capital formation (% of GDP):2017:WBG | 0.0696 | 0.363 | 0.388 | -0.466 | 1.19 | 0.318 |
| Population growth (annual %):2017:WBG | Military expenditure (% of GDP):2017:WBG | 0.0232 | 0.0183 | 0.785 | -0.114 | 0.151 | 0.0649 |
| Population growth (annual %):2017:WBG | Unemployment rate(Percent of total labor force):2017:IMF | -0.00976 | -0.0422 | 0.923 | -0.905 | 0.82 | 0.0685 |
| Population growth (annual %):2017:WBG | Market capitalization of listed domestic companies (% of GDP):2017:WBG | -0.0847 | -3.96 | 0.52 | -16.2 | 8.29 | 0.217 |
| Population growth (annual %):2017:WBG | General government gross debt(Percent of GDP):2017:IMF | -0.0883 | -1.81 | 0.245 | -4.87 | 1.25 | 0.527 |
| Population growth (annual %):2017:WBG | Volume of Imports of goods(Percent change):2017:IMF | -0.0953 | -0.571 | 0.234 | -1.52 | 0.373 | 0.593 |
| Population growth (annual %):2017:WBG | Volume of exports of goods(Percent change):2017:IMF | -0.105 | -0.592 | 0.196 | -1.49 | 0.309 | 0.721 |
| Population growth (annual %):2017:WBG | Gross national savings(Percent of GDP):2017:IMF | -0.136 | -1.06 | 0.0831 | -2.26 | 0.14 | 0.982 |
| Population growth (annual %):2017:WBG | General government net debt(Percent of GDP):2017:IMF | -0.183 | -4.88 | 0.0949 | -10.6 | 0.865 | 0.976 |
| Population growth (annual %):2017:WBG | General government structural balance(Percent of potential GDP):2017:IMF | -0.221 | -0.674 | 0.0523 | -1.36 | 0.00688 | 0.915 |
| 指標1 | 指標2 | 相関係数 | 傾き | 傾きp値 | 傾き信頼区間(下限) | 傾き信頼区間(上限) | 正規性検定p値 |
|---|---|---|---|---|---|---|---|
| Population growth (annual %):2017:WBG | Gross domestic product per capita, constant prices(National currency):2017:IMF | 0.156 | 20,500 | 0.0507 | -64.3 | 41,000 | 0 |
| Population growth (annual %):2017:WBG | Inflation, consumer prices (annual %):2017:WBG | 0.137 | 0.261 | 0.0888 | -0.04 | 0.561 | 0.0237 |
| Population growth (annual %):2017:WBG | Inflation, average consumer prices(Percent change):2017:IMF | 0.134 | 0.297 | 0.0839 | -0.0403 | 0.635 | 0.0207 |
| Population growth (annual %):2017:WBG | Inflation, end of period consumer prices(Percent change):2017:IMF | 0.132 | 0.288 | 0.0865 | -0.0417 | 0.617 | 0.0171 |
| Population growth (annual %):2017:WBG | Net ODA received per capita (current US dollar):2017:WBG | -0.0242 | -1.24 | 0.791 | -10.4 | 7.96 | 0.0299 |
| Population growth (annual %):2017:WBG | Gross domestic product based on purchasing-power-parity (PPP) share of world total(Percent):2017:IMF | -0.152 | -0.0184 | 0.058 | -0.0374 | 0.000634 | 0.0000003 |
世界各国の軍事費
- Source: Stockholm International Peace Research Institute
- https://www.sipri.org/databases/milex
- Military expenditure by country as percentage of gross domestic product.
- Military expenditure per capita by country. Figures are in current US$.
| Date | Year2018 | Year2017 | Year2016 | Year2015 | Year2014 |
|---|---|---|---|---|---|
| Algeria | 5.3 | 6 | 6.4 | 6.3 | 5.5 |
| Morocco | 3.1 | 3.2 | 3.2 | 3.2 | 3.7 |
| Tunisia | 2.1 | 2.1 | 2.3 | 2.3 | 1.9 |
| Angola | 1.8 | 2.4 | 2.7 | 3.1 | 4.7 |
| Benin | 0.9 | 1.3 | 0.9 | 1.1 | 1 |
| Botswana | 2.8 | 3 | 3.3 | 2.7 | 2.1 |
| Burkina Faso | 2.1 | 1.4 | 1.2 | 1.3 | 1.4 |
| Burundi | 1.9 | 1.9 | 2.1 | 2.2 | 2.1 |
| Cameroon | 1.3 | 1.3 | 1.3 | 1.2 | 1.3 |
| Cape Verde | 0.6 | 0.5 | 0.6 | 0.6 | 0.5 |
| Central African Rep. | 1.4 | 1.4 | 1.5 | 1.7 | 2.3 |
| Chad | 2.1 | 2.2 | 3.1 | 2 | 2.8 |
| Congo, Dem. Rep. | 0.7 | 0.7 | 0.9 | 1.3 | 1 |
| Cote d’Ivoire | 1.4 | 1.3 | 1.7 | 1.7 | 1.5 |
| Ethiopia | 0.6 | 0.7 | 0.7 | 0.7 | 0.8 |
| Gabon | 1.5 | 1.8 | 1.4 | 1.2 | 1.1 |
| Ghana | 0.4 | 0.4 | 0.4 | 0.5 | 0.7 |
| Guinea | 2.5 | 2.7 | 2.5 | 3.3 | 3 |
| Kenya | 1.2 | 1.3 | 1.3 | 1.3 | 1.3 |
| Lesotho | 1.8 | 2 | 1.8 | 1.8 | 1.8 |
| Liberia | 0.8 | 0.7 | 0.7 | 0.7 | 0.7 |
| Madagascar | 0.6 | 0.6 | 0.6 | 0.6 | 0.7 |
| Malawi | 0.8 | 0.8 | 0.6 | 0.6 | 0.8 |
| Mali | 2.9 | 3 | 2.6 | 2.4 | 1.5 |
| Mauritania | 3 | 2.9 | 2.9 | 2.8 | 2.7 |
| Mauritius | 0.2 | 0.2 | 0.2 | 0.2 | 0.2 |
| Mozambique | 1 | 1 | 1 | 0.8 | 1 |
| Namibia | 3.3 | 3.6 | 3.9 | 4.5 | 4.2 |
| Nigeria | 0.5 | 0.4 | 0.4 | 0.4 | 0.4 |
| Rwanda | 1.2 | 1.3 | 1.3 | 1.3 | 1.1 |
| Senegal | 1.9 | 1.9 | 2.1 | 1.6 | 1.6 |
| Seychelles | 1.4 | 1.5 | 1.9 | 1.5 | 2.4 |
| Sierra Leone | 0.8 | 1.1 | 1.1 | 0.9 | 1 |
| South Africa | 1 | 1 | 1.1 | 1.1 | 1.1 |
| South Sudan | 1.3 | 2.4 | 4.6 | 10.6 | 8.6 |
| eSwatini | 1.5 | 1.8 | 1.7 | 1.7 | 1.8 |
| Tanzania | 1.2 | 1.2 | 1.1 | 1.1 | 1.1 |
| Togo | 2 | 1.9 | 1.9 | 1.7 | 1.8 |
| Uganda | 1.4 | 1.3 | 1.3 | 1.2 | 1.2 |
| Zambia | 1.4 | 1.3 | 1.4 | 1.8 | 1.6 |
| Zimbabwe | 2.2 | 1.9 | 2.2 | 2.3 | 2.3 |
| Belize | 1.3 | 1.3 | 1.2 | 1.1 | 1.2 |
| Costa Rica | 0 | 0 | 0 | 0 | 0 |
| Dominican Rep. | 0.7 | 0.7 | 0.7 | 0.7 | 0.7 |
| El Salvador | 1 | 1.1 | 1 | 1.1 | 1 |
| Guatemala | 0.4 | 0.4 | 0.4 | 0.4 | 0.4 |
| Haiti | 0 | 0 | 0 | 0 | 0 |
| Honduras | 1.7 | 1.7 | 1.7 | 1.7 | 1.5 |
| Jamaica | 1.4 | 1 | 1 | 0.9 | 0.9 |
| Mexico | 0.5 | 0.5 | 0.6 | 0.7 | 0.7 |
| Nicaragua | 0.6 | 0.6 | 0.6 | 0.8 | 0.7 |
| Panama | 0 | 0 | 0 | 0 | 0 |
| Trinidad & Tobago | 0.8 | 1 | 1 | 0.9 | 0.7 |
| Canada | 1.3 | 1.3 | 1.2 | 1.2 | 1 |
| USA | 3.2 | 3.1 | 3.2 | 3.3 | 3.5 |
| Argentina | 0.9 | 0.9 | 0.8 | 0.9 | 0.9 |
| Bolivia | 1.5 | 1.5 | 1.6 | 1.7 | 1.9 |
| Brazil | 1.5 | 1.4 | 1.4 | 1.4 | 1.3 |
| Chile | 1.9 | 1.9 | 1.9 | 1.9 | 2 |
| Colombia | 3.2 | 3.2 | 3.1 | 3.1 | 3.1 |
| Ecuador | 2.4 | 2.4 | 2.5 | 2.6 | 2.7 |
| Guyana | 1.7 | 1.7 | 1.5 | 1.5 | 1.3 |
| Paraguay | 0.9 | 0.9 | 1 | 1.1 | 1 |
| Peru | 1.2 | 1.2 | 1.3 | 1.7 | 1.6 |
| Uruguay | 2 | 2 | 1.9 | 1.8 | 1.8 |
| Kazakhstan | 1 | 0.9 | 1 | 1.1 | 1 |
| Kyrgyzstan | 1.6 | 1.7 | 1.8 | 1.8 | 1.7 |
| China | 1.9 | 1.9 | 1.9 | 1.9 | 1.9 |
| Japan | 0.9 | 0.9 | 0.9 | 1 | 1 |
| Korea, South | 2.6 | 2.6 | 2.6 | 2.6 | 2.7 |
| Mongolia | 0.8 | 0.7 | 0.9 | 0.9 | 0.9 |
| Taiwan | 1.8 | 1.8 | 1.8 | 1.9 | 1.8 |
| Afghanistan | 1 | 0.9 | 1 | 1 | 1.3 |
| Bangladesh | 1.4 | 1.4 | 1.4 | 1.4 | 1.3 |
| India | 2.4 | 2.5 | 2.5 | 2.4 | 2.5 |
| Nepal | 1.4 | 1.6 | 1.7 | 1.6 | 1.6 |
| Pakistan | 4 | 3.8 | 3.6 | 3.6 | 3.5 |
| Sri Lanka | 1.9 | 2.1 | 2.1 | 2.6 | 2.4 |
| Brunei | 2.4 | 2.9 | 3.5 | 3.3 | 3.1 |
| Cambodia | 2.2 | 2.1 | 1.9 | 1.8 | 1.7 |
| Indonesia | 0.7 | 0.8 | 0.8 | 0.9 | 0.8 |
| Malaysia | 1 | 1.1 | 1.4 | 1.5 | 1.5 |
| Myanmar | 2.9 | 3.2 | 3.7 | 4.1 | 3.6 |
| Philippines | 1.1 | 1.2 | 1.4 | 1.1 | 1.1 |
| Singapore | 3.1 | 3.2 | 3.2 | 3.1 | 3.1 |
| Thailand | 1.3 | 1.4 | 1.4 | 1.4 | 1.4 |
| Timor-Leste | 0.6 | 0.9 | 1 | 1.2 | 0.7 |
| Viet Nam | 2.3 | 2.3 | 2.4 | 2.4 | 2.3 |
| Australia | 1.9 | 2 | 2.1 | 2 | 1.8 |
| Fiji | 0.9 | 0.9 | 0.9 | 1 | 1 |
| New Zealand | 1.2 | 1.2 | 1.2 | 1.1 | 1.2 |
| Papua New Guinea | 0.3 | 0.3 | 0.4 | 0.5 | 0.5 |
| Albania | 1.2 | 1.1 | 1.1 | 1.2 | 1.3 |
| Bosnia-Herzegovina | 1.1 | 0.9 | 0.9 | 1 | 1 |
| Bulgaria | 1.7 | 1.4 | 1.4 | 1.3 | 1.5 |
| Croatia | 1.5 | 1.4 | 1.4 | 1.5 | 1.6 |
| Czechia | 1.1 | 1 | 1 | 1 | 1 |
| Estonia | 2.1 | 2 | 2.1 | 2 | 1.9 |
| Hungary | 1.1 | 1.1 | 1 | 0.9 | 0.9 |
| Kosovo | 0.8 | 0.8 | 0.8 | 0.8 | 0.7 |
| Latvia | 2 | 1.7 | 1.5 | 1 | 0.9 |
| Lithuania | 2 | 1.7 | 1.5 | 1.1 | 0.9 |
| Montenegro | 1.5 | 1.4 | 1.4 | 1.4 | 1.5 |
| Norh Macedonia | 1 | 1 | 0.9 | 1 | 1.1 |
| Poland | 2 | 1.9 | 1.9 | 2.1 | 1.9 |
| Romania | 1.9 | 1.7 | 1.4 | 1.5 | 1.3 |
| Serbia | 1.9 | 2 | 1.9 | 1.9 | 2.1 |
| Slovakia | 1.2 | 1.1 | 1.1 | 1.1 | 1 |
| Slovenia | 1 | 1 | 1 | 0.9 | 1 |
| Armenia | 4.8 | 3.8 | 4.1 | 4.2 | 3.9 |
| Azerbaijan | 3.8 | 3.8 | 3.7 | 5.5 | 4.6 |
| Belarus | 1.3 | 1.2 | 1.3 | 1.3 | 1.3 |
| Georgia | 1.9 | 2 | 2.2 | 2.1 | 2.5 |
| Moldova | 0.3 | 0.4 | 0.4 | 0.4 | 0.3 |
| Russia | 3.9 | 4.2 | 5.5 | 4.9 | 4.1 |
| Ukraine | 3.8 | 3.2 | 3.7 | 4 | 3 |
| Austria | 0.7 | 0.8 | 0.7 | 0.7 | 0.7 |
| Belgium | 0.9 | 0.9 | 0.9 | 0.9 | 1 |
| Cyprus | 1.6 | 1.6 | 1.4 | 1.7 | 1.5 |
| Denmark | 1.2 | 1.1 | 1.2 | 1.1 | 1.1 |
| Finland | 1.4 | 1.4 | 1.4 | 1.5 | 1.5 |
| France | 2.3 | 2.3 | 2.3 | 2.3 | 2.2 |
| Germany | 1.2 | 1.2 | 1.2 | 1.2 | 1.2 |
| Greece | 2.4 | 2.5 | 2.5 | 2.5 | 2.3 |
| Ireland | 0.3 | 0.3 | 0.3 | 0.3 | 0.5 |
| Italy | 1.3 | 1.4 | 1.3 | 1.2 | 1.3 |
| Luxembourg | 0.6 | 0.6 | 0.4 | 0.5 | 0.4 |
| Malta | 0.5 | 0.5 | 0.5 | 0.5 | 0.5 |
| Netherlands | 1.2 | 1.2 | 1.2 | 1.1 | 1.2 |
| Norway | 1.6 | 1.6 | 1.6 | 1.5 | 1.5 |
| Portugal | 1.8 | 1.7 | 1.7 | 1.8 | 1.8 |
| Spain | 1.3 | 1.2 | 1.1 | 1.3 | 1.2 |
| Sweden | 1 | 1 | 1.1 | 1.1 | 1.1 |
| Switzerland | 0.7 | 0.7 | 0.7 | 0.7 | 0.7 |
| UK | 1.8 | 1.8 | 1.8 | 1.9 | 1.9 |
| Bahrain | 3.6 | 4.4 | 4.7 | 4.6 | 4.4 |
| Egypt | 1.2 | 1.4 | 1.7 | 1.7 | 1.7 |
| Iran | 2.7 | 3.1 | 3 | 2.8 | 2.3 |
| Iraq | 2.7 | 3.8 | 3.5 | 5.3 | 3 |
| Israel | 4.3 | 4.4 | 4.6 | 5.6 | 6 |
| Jordan | 4.7 | 4.8 | 4.6 | 4.3 | 4.3 |
| Kuwait | 5.1 | 5.6 | 5.8 | 5 | 3.6 |
| Lebanon | 5 | 4.6 | 5.2 | 4.5 | 4.7 |
| Oman | 8.2 | 9.6 | 12 | 10.8 | 10.1 |
| Saudi Arabia | 8.8 | 10.3 | 9.9 | 13.3 | 10.7 |
| Turkey | 2.5 | 2.1 | 2.1 | 1.8 | 1.9 |
| Date | Year2018 | Year2017 | Year2016 | Year2015 | Year2014 |
|---|---|---|---|---|---|
| Algeria | 228.1 | 243.8 | 251.6 | 261.2 | 248.6 |
| Morocco | 102.1 | 96.9 | 94.3 | 93.9 | 118 |
| Tunisia | 72.4 | 74.5 | 86.6 | 86.9 | 81.5 |
| Angola | 64.5 | 102.8 | 95.9 | 129.5 | 254.2 |
| Benin | 7.9 | 10.4 | 7.3 | 8.6 | 9 |
| Botswana | 226.9 | 228 | 228.6 | 173.7 | 159.7 |
| Burkina Faso | 15.8 | 10 | 8 | 8.2 | 10.1 |
| Burundi | 5.8 | 5.9 | 6.3 | 6.5 | 6.3 |
| Cameroon | 17.4 | 17 | 16.5 | 15.5 | 18.1 |
| Cape Verde | 19.4 | 17.1 | 18.9 | 16.7 | 19.1 |
| Chad | 15.2 | 14.7 | 21.4 | 15.8 | 28.9 |
| Congo, Dem. Rep. | 3.5 | 3.6 | 5 | 6.4 | 4.6 |
| Cote d’Ivoire | 24.4 | 20.6 | 25.4 | 24.7 | 23.1 |
| Ethiopia | 4.6 | 4.8 | 4.8 | 4.4 | 4.3 |
| Gabon | 126.3 | 132.1 | 102.4 | 88.3 | 111 |
| Ghana | 7.4 | 6.6 | 5.7 | 6.9 | 9.4 |
| Guinea | 16 | 15.7 | 13.1 | 18.3 | 16.7 |
| Kenya | 21.5 | 20.4 | 19.3 | 17.9 | 17.8 |
| Lesotho | 22.6 | 23.5 | 18.8 | 20.2 | 22.2 |
| Liberia | 3.3 | 3.2 | 3.2 | 3.3 | 3.3 |
| Madagascar | 2.8 | 2.6 | 2.4 | 2.4 | 3 |
| Malawi | 3 | 2.5 | 2 | 2.3 | 2.9 |
| Mali | 25.9 | 24.7 | 20.1 | 17.7 | 12.9 |
| Mauritius | 18.3 | 18.8 | 18.2 | 16.7 | 15.7 |
| Mozambique | 4.8 | 4.3 | 3.9 | 4.3 | 6.4 |
| Namibia | 174.5 | 180.7 | 171.5 | 213.7 | 226.7 |
| Nigeria | 10.4 | 8.5 | 9.3 | 11.4 | 13.4 |
| Rwanda | 9.5 | 9.5 | 9 | 8.9 | 8 |
| Senegal | 21.3 | 19.3 | 19.8 | 14.3 | 16.5 |
| Seychelles | 239.7 | 235 | 283.6 | 219.9 | 349.6 |
| Sierra Leone | 3.8 | 5.2 | 5.1 | 5.4 | 6.9 |
| South Africa | 63.4 | 64.2 | 56.6 | 63.1 | 71.4 |
| South Sudan | 4.6 | 5.8 | 11.1 | 96.9 | 112.9 |
| Tanzania | 11.4 | 10.7 | 9.8 | 9.6 | 9.7 |
| Togo | 13.1 | 11.3 | 10.8 | 9.4 | 11.5 |
| Uganda | 9.2 | 8.1 | 7.7 | 7.6 | 8.4 |
| Zambia | 21.5 | 19.9 | 18.1 | 23.1 | 28.4 |
| Zimbabwe | 24.9 | 20.6 | 22.2 | 23.9 | 23.9 |
| Belize | 60.4 | 62.6 | 59.2 | 54.9 | 56.6 |
| Dominican Rep. | 55.4 | 49.5 | 45 | 43.5 | 42.1 |
| El Salvador | 41.6 | 40.9 | 39 | 39.2 | 37.2 |
| Guatemala | 16.1 | 16.3 | 17.5 | 15.5 | 15.4 |
| Honduras | 43.6 | 43 | 39.9 | 39.8 | 35.7 |
| Jamaica | 71.7 | 49.7 | 47.8 | 43.1 | 42.4 |
| Mexico | 50.2 | 44.8 | 47.2 | 61.5 | 69.7 |
| Nicaragua | 13 | 13.9 | 13.8 | 16.3 | 13.5 |
| Trinidad & Tobago | 123.4 | 148.1 | 158.4 | 148.6 | 139.5 |
| Canada | 585.1 | 582.8 | 490 | 499 | 501.4 |
| USA | 1,985.5 | 1,867.1 | 1,862.6 | 1,863.2 | 1,919.7 |
| Argentina | 92.8 | 123.3 | 102.8 | 126.3 | 115.9 |
| Bolivia | 55.2 | 51.9 | 50.7 | 53.7 | 59.3 |
| Brazil | 131.7 | 139.9 | 116.7 | 119.5 | 159.9 |
| Chile | 306.1 | 297.4 | 267.8 | 260.7 | 289.7 |
| Colombia | 214.4 | 204.2 | 178.3 | 189.2 | 247.9 |
| Ecuador | 151.2 | 148.1 | 153.4 | 160.9 | 175.2 |
| Guyana | 76.5 | 76.8 | 66.7 | 60.4 | 51.5 |
| Paraguay | 56 | 51.1 | 51 | 58.2 | 60.8 |
| Peru | 83.2 | 82.9 | 79.8 | 105.6 | 103.9 |
| Uruguay | 336.7 | 337.2 | 286.9 | 282.6 | 302.5 |
| Kazakhstan | 87.7 | 76.4 | 71.2 | 115.3 | 131.9 |
| Kyrgyzstan | 19.8 | 20.1 | 19.4 | 19.9 | 22.2 |
| China | 176.7 | 161.6 | 153.9 | 153.2 | 144.4 |
| Japan | 366.5 | 356 | 363.8 | 329 | 365.8 |
| Korea, South | 841.8 | 768.3 | 726.2 | 722.8 | 745.3 |
| Mongolia | 30.8 | 26.9 | 31.8 | 34.2 | 35.9 |
| Taiwan | 452.2 | 443.6 | 410.2 | 417.4 | 418.7 |
| Afghanistan | 5.4 | 5.4 | 5.4 | 5.9 | 8.2 |
| Bangladesh | 23.4 | 21.8 | 19.9 | 17.5 | 14.8 |
| India | 49.1 | 48.2 | 42.8 | 39.2 | 39.4 |
| Nepal | 13.5 | 13.8 | 12.3 | 11.3 | 11.6 |
| Pakistan | 56.6 | 58.2 | 51.6 | 50.1 | 46.6 |
| Sri Lanka | 80.3 | 89.4 | 83.7 | 99.3 | 92.8 |
| Brunei | 798.5 | 808.7 | 953.1 | 1,015.5 | 1,282 |
| Cambodia | 33.4 | 29 | 24.2 | 21 | 18.2 |
| Indonesia | 27.9 | 31 | 28.3 | 29.6 | 27.2 |
| Malaysia | 108.3 | 110.5 | 133.7 | 147.5 | 162.7 |
| Myanmar | 37.7 | 41.6 | 46.4 | 48.7 | 45.7 |
| Philippines | 35.4 | 35.8 | 42.2 | 32.8 | 31 |
| Singapore | 1,871.8 | 1,786 | 1,756.1 | 1,695.3 | 1,761.4 |
| Thailand | 98.7 | 91.3 | 85.3 | 83.4 | 83.7 |
| Timor-Leste | 15.6 | 19.6 | 20.7 | 29.8 | 24.4 |
| Viet Nam | 57 | 53.1 | 53.1 | 48.8 | 46 |
| Australia | 1,078.3 | 1,132.5 | 1,093.6 | 1,010.3 | 1,098.4 |
| Fiji | 53.1 | 50.5 | 47.5 | 47.5 | 52 |
| New Zealand | 476.4 | 494.7 | 449.1 | 421.2 | 498 |
| Papua New Guinea | 7.2 | 8.7 | 9.8 | 12.6 | 14.5 |
| Albania | 61.5 | 49.3 | 44.7 | 45.3 | 61 |
| Bosnia-Herzegovina | 63.1 | 46.9 | 44.9 | 45.9 | 53.4 |
| Bulgaria | 155.7 | 116.3 | 105.9 | 92.1 | 115.7 |
| Croatia | 213.6 | 187.2 | 166.6 | 177.9 | 212.9 |
| Czechia | 255.1 | 195.7 | 184.2 | 167.9 | 190.9 |
| Estonia | 473.3 | 410.4 | 379.2 | 352.4 | 388.5 |
| Hungary | 169.5 | 150.5 | 132.1 | 115.7 | 123.3 |
| Kosovo | 32.7 | 29.8 | 27.3 | 30 | 29.4 |
| Latvia | 352.3 | 261.3 | 206.5 | 141.9 | 146.7 |
| Lithuania | 358.2 | 281 | 218.5 | 160.7 | 144.1 |
| Montenegro | 133.2 | 104.5 | 98.2 | 90.6 | 107.6 |
| North Macedonia | 56.3 | 53.7 | 48.8 | 48.1 | 59.8 |
| Poland | 304.3 | 258.6 | 239.7 | 266.9 | 270.2 |
| Romania | 235.4 | 184.1 | 133.7 | 129.8 | 134.8 |
| Serbia | 103.2 | 91.2 | 80.5 | 81.8 | 102.8 |
| Slovakia | 235 | 192.6 | 184.2 | 181.3 | 183.6 |
| Slovenia | 254.4 | 227.8 | 216.2 | 193.2 | 234.8 |
| Armenia | 207.5 | 151.4 | 147.5 | 153.4 | 157.5 |
| Azerbaijan | 172.2 | 155.6 | 143.6 | 306 | 360.6 |
| Belarus | 75.7 | 66.7 | 63 | 76.3 | 106.6 |
| Georgia | 81 | 78.8 | 80.3 | 75.8 | 104.1 |
| Moldova | 8.4 | 7.6 | 7.3 | 5.7 | 6.8 |
| Russia | 426.4 | 462 | 481 | 461.6 | 589.1 |
| Ukraine | 107.9 | 82.5 | 77 | 81 | 89.9 |
| Austria | 384.8 | 359.3 | 331.3 | 307.1 | 382.8 |
| Belgium | 431.3 | 392.4 | 379.8 | 372.3 | 462.7 |
| Cyprus | 321.2 | 303 | 252.4 | 282.4 | 310.5 |
| Denmark | 734.8 | 656.5 | 629 | 591.4 | 716.3 |
| Finland | 694.5 | 621 | 620.6 | 620.1 | 730 |
| France | 978 | 929.8 | 886.2 | 858.6 | 991 |
| Germany | 601.1 | 552.7 | 507.6 | 487.3 | 565.7 |
| Greece | 469.1 | 456.4 | 443.8 | 429.5 | 491 |
| Ireland | 251.4 | 215.3 | 211.9 | 212.1 | 254.5 |
| Italy | 469 | 445.6 | 421.2 | 372.8 | 464.9 |
| Luxembourg | 710.4 | 613 | 452.9 | 487.3 | 501.5 |
| Malta | 160.3 | 149.1 | 139 | 121.1 | 132.8 |
| Netherlands | 658.1 | 562.4 | 536.6 | 511.7 | 611.8 |
| Norway | 1,320.1 | 1,218.7 | 1,141.3 | 1,118.3 | 1,426.8 |
| Portugal | 412.8 | 353 | 344.1 | 342.2 | 392.7 |
| Spain | 393.3 | 346.1 | 302.4 | 327.4 | 369.3 |
| Sweden | 576.5 | 557.6 | 551.7 | 551.8 | 676.6 |
| Switzerland | 561.3 | 546.1 | 544.1 | 543.4 | 560.5 |
| UK | 751 | 701.6 | 731.4 | 823.6 | 910.3 |
| Bahrain | 891.4 | 1,026.9 | 1,056.4 | 1,051.1 | 1,103.9 |
| Egypt | 31.3 | 28.3 | 47.2 | 58.4 | 55.4 |
| Iran | 160.9 | 171.6 | 152.8 | 133.4 | 126.3 |
| Iraq | 160.6 | 193.8 | 160.5 | 265.9 | 197.7 |
| Israel | 1,886.6 | 1,872.4 | 1,804.7 | 2,104.2 | 2,327.8 |
| Jordan | 197.7 | 199.9 | 187 | 176.3 | 175.8 |
| Kuwait | 1,738.4 | 1,635.3 | 1,590.8 | 1,457.2 | 1,541.9 |
| Lebanon | 455.5 | 401.3 | 433.9 | 382.7 | 405.1 |
| Oman | 1,389.3 | 1,467.3 | 1,793.5 | 1,793.8 | 2,073.6 |
| Saudi Arabia | 2,013.3 | 2,137.3 | 1,972.8 | 2,762.8 | 2,624.1 |
| Turkey | 231.5 | 220.7 | 224.5 | 202.9 | 230.7 |
武器販売額
- Source: Stockholm International Peace Research Institute
- https://www.sipri.org/databases/armsindustry
- Figures for arms sales, total sales and profit are in millions of US dollar.
- The SIPRI Top 100 arms-producing and military services companies in the world (excluding China), 2017
| Rank (2017) | Company | Country | Arms Sales (2017) | Total Sales (2017) | Arms sales as a % of total sales (2017) |
|---|---|---|---|---|---|
| 1 | Lockheed Martin Corp. | United States | 44,920 | 51,048 | 88 |
| 2 | Boeing | United States | 26,930 | 93,392 | 29 |
| 3 | Raytheon | United States | 23,870 | 25,348 | 94 |
| 4 | BAE Systems | United Kingdom | 22,940 | 23,490 | 98 |
| 5 | Northrop Grumman Corp. | United States | 22,370 | 25,803 | 87 |
| 6 | General Dynamics Corp. | United States | 19,460 | 30,973 | 63 |
| 7 | Airbus Group | Trans-European | 11,290 | 75,239 | 15 |
| 8 | Thales | France | 9,000 | 17,799 | 51 |
| 9 | Leonardo | Italy | 8,860 | 12,990 | 68 |
| 10 | Almaz-Antey | Russia | 8,570 | 9,122 | 94 |
- Figures for arms sales, total sales and profit are in millions of US dollar.
- The SIPRI Top 100 arms-producing and military services companies in the world (excluding China), 2016
| Rank (2016) | Company | Country | Arms Sales (2016) | Total Sales (2016) | Arms sales as a % of total sales (2016) | Arms sales 2016 (constant 2017 prices) |
|---|---|---|---|---|---|---|
| 1 | Lockheed Martin Corp. | United States | 40,630 | 47,248 | 86 | 41,485.907 |
| 2 | Boeing | United States | 29,510 | 94,571 | 31 | 30,131.654 |
| 3 | Raytheon | United States | 22,910 | 24,069 | 95 | 23,392.619 |
| 4 | BAE Systems | United Kingdom | 22,790 | 24,008 | 95 | 22,208.44 |
| 5 | Northrop Grumman Corp. | United States | 21,400 | 24,508 | 87 | 21,850.81 |
| 6 | General Dynamics Corp. | United States | 19,230 | 31,353 | 61 | 19,635.097 |
| 7 | Airbus Group | Trans-European | 12,520 | 73,652 | 17 | 12,928.2 |
| 0 | BAE Systems Inc. (BAE Systems UK) | United States | 9,300 | 10,000 | 93 | 9,495.913 |
| 8 | Leonardo | Italy | 8,500 | 13,277 | 64 | 8,781.248 |
| 9 | Thales | France | 8,170 | 16,471 | 50 | 8,419.745 |
| 10 | L-3 Communications | United States | 7,630 | 9,210 | 83 | 7,790.733 |
- Figures for arms sales, total sales and profit are in millions of US dollar.
- The SIPRI Top 100 arms-producing and military services companies in the world (excluding China), 2015
| Rank (2015) | Company | Country | Arms Sales (2015) | Total Sales (2015) | Arms sales as a % of total sales (2015) | Arms sales 2015 (constant 2017 prices) |
|---|---|---|---|---|---|---|
| 1 | Lockheed Martin Corp. | United States | 36,440 | 46,132 | 79 | 37,677.046 |
| 2 | Boeing | United States | 27,960 | 96,114 | 29 | 28,909.171 |
| 3 | BAE Systems | United Kingdom | 25,510 | 25,647 | 99 | 22,110.455 |
| 4 | Raytheon | United States | 21,780 | 23,247 | 94 | 22,519.376 |
| 5 | Northrop Grumman Corp. | United States | 20,060 | 23,256 | 86 | 20,740.986 |
| 6 | General Dynamics Corp. | United States | 19,240 | 31,469 | 61 | 19,893.149 |
| 7 | Airbus Group | Trans-European | 12,860 | 71,476 | 18 | 12,568.526 |
| 0 | BAE Systems Inc. (BAE Systems UK) | United States | 9,670 | 10,400 | 93 | 9,998.272 |
| 8 | United Technologies Corp. | United States | 9,500 | 61,047 | 16 | 9,822.501 |
| 9 | Finmeccanica | Italy | 9,300 | 14,412 | 65 | 9,570.647 |
| 10 | L-3 Communications | United States | 8,770 | 10,466 | 84 | 9,067.719 |
- Figures for arms sales, total sales and profit are in millions of US dollar.
- The SIPRI Top 100 arms-producing and military services companies in the world (excluding China), 2014
| Rank (2014) | Company | Country | Arms Sales (2014) | Total Sales (2014) | Arms sales as a % of total sales (2014) | Arms sales 2014 (constant 2017 prices) |
|---|---|---|---|---|---|---|
| 1 | Lockheed Martin Corp. | United States | 36,480 | 45,600 | 80 | 37,763.15 |
| 2 | Boeing | United States | 28,300 | 90,762 | 31 | 29,295.42 |
| 3 | BAE Systems | United Kingdom | 25,730 | 27,395 | 94 | 20,716.42 |
| 4 | Raytheon | United States | 21,370 | 22,826 | 94 | 22,121.67 |
| 5 | Northrop Grumman Corp. | United States | 19,660 | 23,979 | 82 | 20,351.52 |
| 6 | General Dynamics Corp. | United States | 18,600 | 30,852 | 60 | 19,254.24 |
| 7 | Airbus Group | Trans-European | 14,490 | 80,521 | 18 | 12,533.59 |
| 8 | United Technologies Corp. | United States | 13,020 | 65,100 | 20 | 13,477.97 |
| 9 | Finmeccanica | Italy | 10,540 | 19,455 | 54 | 9,070.71 |
| 10 | L-3 Communications | United States | 9,810 | 12,124 | 81 | 10,155.06 |
- Figures for arms sales, total sales and profit are in millions of US dollar.
- The SIPRI Top 100 arms-producing and military services companies in the world (excluding China), 2013
| Rank (2013) | Company | Country | Arms Sales (2013) | Total Sales (2013) | Arms sales as a % of total sales (2013) | Arms sales 2013 (constant 2017 prices) |
|---|---|---|---|---|---|---|
| 1 | Lockheed Martin Corp. | United States | 35,400 | 45,358 | 78 | 37,239.626 |
| 2 | Boeing | United States | 30,700 | 86,623 | 35 | 32,295.382 |
| 3 | BAE Systems | United Kingdom | 26,830 | 28,421 | 94 | 23,069.093 |
| 4 | Raytheon | United States | 21,950 | 23,706 | 93 | 23,090.672 |
| 5 | Northrop Grumman Corp. | United States | 20,200 | 24,661 | 82 | 21,249.73 |
| 6 | General Dynamics Corp. | United States | 18,660 | 31,218 | 60 | 19,629.701 |
| 7 | EADS | Trans-European | 15,740 | 78,693 | 20 | 13,700.793 |
| 8 | United Technologies Corp. | United States | 11,900 | 62,626 | 19 | 12,518.405 |
| 9 | Finmeccanica | Italy | 10,560 | 21,292 | 50 | 9,102.941 |
| 10 | Thales | France | 10,370 | 18,850 | 55 | 8,968.423 |
- Figures for arms sales, total sales and profit are in millions of US dollar.
- The SIPRI Top 100 arms-producing and military services companies in the world (excluding China), 2012
| Rank (2012) | Company | Country | Arms Sales (2012) | Total Sales (2012) | Arms sales as a % of total sales (2012) | Arms sales 2012 (constant 2017 prices) |
|---|---|---|---|---|---|---|
| 1 | Lockheed Martin Corp. | United States | 36,000 | 47,182 | 76 | 38,425.55 |
| 2 | Boeing | United States | 30,600 | 81,698 | 37 | 32,661.72 |
| 3 | BAE Systems | United Kingdom | 26,760 | 28,172 | 95 | 23,352.71 |
| 4 | Raytheon | United States | 22,500 | 24,414 | 92 | 24,015.97 |
| 5 | General Dynamics Corp. | United States | 20,940 | 31,513 | 66 | 22,350.86 |
| 6 | Northrop Grumman Corp. | United States | 19,400 | 25,218 | 77 | 20,707.1 |
| 7 | EADS | Trans-European | 15,400 | 72,596 | 21 | 14,016.2 |
| 8 | Finmeccanica | Italy | 12,530 | 22,131 | 57 | 11,297.72 |
| 9 | United Technologies Corp. | United States | 12,120 | 57,708 | 21 | 12,936.6 |
| 10 | L-3 Communications | United States | 10,840 | 13,146 | 82 | 11,570.36 |
- Figures for arms sales, total sales and profit are in millions of US dollar.
- The SIPRI Top 100 arms-producing and military services companies in the world (excluding China), 2011
| Rank (2011) | Company | Country | Arms Sales (2011) | Total Sales (2011) | Arms sales as a % of total sales (2011) | Arms sales 2011 (constant 2017 prices) |
|---|---|---|---|---|---|---|
| 1 | Lockheed Martin Corp. | United States | 36,270 | 46,499 | 78 | 39,514.86 |
| 2 | Boeing | United States | 30,300 | 68,735 | 44 | 33,010.76 |
| 3 | BAE Systems | United Kingdom | 29,150 | 30,689 | 95 | 25,788.21 |
| 4 | General Dynamics Corp. | United States | 23,330 | 32,677 | 71 | 25,417.2 |
| 5 | Raytheon | United States | 22,900 | 24,791 | 92 | 24,948.73 |
| 6 | Northrop Grumman Corp. | United States | 20,340 | 26,412 | 77 | 22,159.7 |
| 7 | EADS | Trans-European | 16,400 | 68,328 | 24 | 14,069.47 |
| 8 | Finmeccanica | Italy | 14,560 | 24,074 | 60 | 12,502.92 |
| S | BAE Systems Inc. (BAE Systems UK) | United States | 13,560 | 14,417 | 94 | 14,773.13 |
| 9 | L-3 Communications | United States | 12,520 | 15,169 | 83 | 13,640.09 |
| 10 | United Technologies Corp. | United States | 11,150 | 55,754 | 20 | 12,147.52 |
- Figures for arms sales, total sales and profit are in millions of US dollar.
- The SIPRI Top 100 arms-producing and military services companies in the world (excluding China), 2010
| Rank (2010) | Company | Country | Arms Sales (2010) | Total Sales (2010) | Arms sales as a % of total sales (2010) | Arms sales 2010 (constant 2017 prices) |
|---|---|---|---|---|---|---|
| 1 | Lockheed Martin Corp. | United States | 35,730 | 45,803 | 78 | 40,155.4 |
| 2 | BAE Systems | United Kingdom | 32,870 | 34,599 | 95 | 31,504.69 |
| 3 | Boeing | United States | 30,000 | 64,306 | 47 | 33,715.7 |
| 4 | Northrop Grumman Corp. | United States | 26,800 | 34,757 | 77 | 30,119.36 |
| 5 | General Dynamics Corp. | United States | 23,940 | 32,466 | 74 | 26,905.13 |
| 6 | Raytheon | United States | 22,980 | 25,183 | 91 | 25,826.23 |
| S | BAE Systems Inc. (BAE Systems UK) | United States | 17,900 | 17,903 | 100 | 20,117.03 |
| 7 | EADS | Trans-European | 16,360 | 60,599 | 27 | 15,040.32 |
| 8 | Finmeccanica | Italy | 14,410 | 24,762 | 58 | 13,344.11 |
| 9 | L-3 Communications | United States | 13,070 | 15,680 | 83 | 14,688.81 |
| 10 | United Technologies Corp. | United States | 10,980 | 52,275 | 21 | 12,339.95 |
- Figures for arms sales, total sales and profit are in millions of US dollar.
- The SIPRI Top 100 arms-producing and military services companies in the world (excluding China), 2009
| Rank (2009) | Company | Country | Arms Sales (2009) | Total Sales (2009) | Arms sales as a % of total sales (2009) | Arms sales 2009 (constant 2017 prices) |
|---|---|---|---|---|---|---|
| 1 | Lockheed Martin Corp. | United States | 33,430 | 45,189 | 74 | 38,186.7 |
| 2 | BAE Systems | United Kingdom | 32,540 | 34,257 | 95 | 31,951.33 |
| 3 | Boeing | United States | 31,900 | 68,281 | 47 | 36,439 |
| 4 | Northrop Grumman Corp. | United States | 26,000 | 33,755 | 77 | 29,699.5 |
| 5 | General Dynamics Corp. | United States | 23,380 | 31,981 | 73 | 26,706.7 |
| 6 | Raytheon | United States | 23,080 | 24,881 | 93 | 26,364.02 |
| S | BAE Systems Inc. (BAE Systems UK) | United States | 19,280 | 19,276 | 100 | 22,023.32 |
| 7 | EADS | Trans-European | 15,930 | 59,475 | 27 | 14,145.99 |
| 8 | Finmeccanica | Italy | 13,280 | 25,244 | 53 | 11,904.92 |
| 9 | L-3 Communications | United States | 13,010 | 15,615 | 83 | 14,861.17 |
| 10 | United Technologies Corp. | United States | 10,640 | 50,649 | 21 | 12,153.95 |
- Figures for arms sales, total sales and profit are in millions of US dollar.
- The SIPRI Top 100 arms-producing and military services companies in the world (excluding China), 2008
| Rank (2008) | Company | Country | Arms Sales (2008) | Total Sales (2008) | Arms sales as a % of total sales (2008) | Arms sales 2008 (constant 2017 prices) |
|---|---|---|---|---|---|---|
| 1 | BAE Systems | United Kingdom | 32,420 | 34,086 | 95 | 27,560.265 |
| 2 | Boeing | United States | 30,000 | 60,909 | 49 | 34,146.811 |
| 3 | Lockheed Martin Corp. | United States | 29,880 | 42,731 | 70 | 34,010.224 |
| 4 | Northrop Grumman Corp. | United States | 26,090 | 33,887 | 77 | 29,696.344 |
| 5 | General Dynamics Corp. | United States | 21,070 | 29,300 | 72 | 23,982.444 |
| 6 | Raytheon | United States | 21,030 | 23,174 | 91 | 23,936.915 |
| S | BAE Systems Inc. (BAE Systems UK) | United States | 19,970 | 19,974 | 100 | 22,730.394 |
| 7 | EADS | Trans-European | 17,900 | 63,346 | 28 | 15,104.849 |
| 8 | Finmeccanica | Italy | 13,240 | 25,037 | 53 | 11,340.616 |
| 9 | L-3 Communications | United States | 12,160 | 14,901 | 82 | 13,840.841 |
| 10 | Thales | France | 10,760 | 18,543 | 58 | 9,001.148 |
- Figures for arms sales, total sales and profit are in millions of US dollar.
- The SIPRI Top 100 arms-producing and military services companies in the world (excluding China), 2007
| Rank (2007) | Company | Country | Arms Sales (2007) | Total Sales (2007) | Arms sales as a % of total sales (2007) | Arms sales 2007 (constant 2017 prices) |
|---|---|---|---|---|---|---|
| 1 | Boeing | United States | 30,480 | 66,387 | 46 | 36,025.065 |
| 2 | BAE Systems | United Kingdom | 29,860 | 31,426 | 95 | 24,164.41 |
| 3 | Lockheed Martin Corp. | United States | 29,400 | 41,862 | 70 | 34,748.587 |
| 4 | Northrop Grumman Corp. | United States | 24,600 | 32,018 | 77 | 29,075.348 |
| 5 | General Dynamics Corp. | United States | 21,520 | 27,240 | 79 | 25,435.02 |
| 6 | Raytheon | United States | 19,540 | 21,301 | 92 | 23,094.809 |
| S | BAE Systems Inc. (BAE Systems UK) | United States | 14,910 | 14,908 | 100 | 17,622.498 |
| 7 | EADS | Trans-European | 13,090 | 53,520 | 24 | 12,143.682 |
| 8 | L-3 Communications | United States | 11,240 | 13,961 | 81 | 13,284.834 |
| 9 | Finmeccanica | Italy | 9,850 | 18,376 | 54 | 9,334.484 |
| 10 | Thales | France | 9,350 | 16,825 | 56 | 8,606.712 |
- Figures for arms sales, total sales and profit are in millions of US dollar.
- The SIPRI Top 100 arms-producing and military services companies in the world (excluding China), 2006
| Rank (2006) | Company | Country | Arms Sales (2006) | Total Sales (2006) | Arms sales as a % of total sales (2006) | Arms sales 2006 (constant 2017 prices) |
|---|---|---|---|---|---|---|
| 1 | Boeing | United States | 30,690 | 61,530 | 50 | 37,308.027 |
| 2 | Lockheed Martin Corp. | United States | 28,120 | 39,620 | 71 | 34,183.829 |
| 3 | BAE Systems | United Kingdom | 24,060 | 25,327 | 95 | 21,665.275 |
| 4 | Northrop Grumman Corp. | United States | 23,650 | 30,148 | 78 | 28,749.913 |
| 5 | General Dynamics Corp. | United States | 18,770 | 24,063 | 78 | 22,817.585 |
| 6 | Raytheon | United States | 17,610 | 20,291 | 87 | 21,407.441 |
| 7 | EADS | Trans-European | 12,600 | 49,478 | 25 | 12,994.427 |
| S | BAE Systems Inc. (BAE Systems UK) | United States | 11,280 | 11,283 | 100 | 13,712.432 |
| 8 | L-3 Communications | United States | 9,980 | 12,477 | 80 | 12,132.099 |
| 9 | Finmeccanica | Italy | 8,640 | 15,649 | 55 | 9,095.777 |
| 10 | Thales | France | 8,240 | 12,878 | 64 | 8,398.486 |
- Figures for arms sales, total sales and profit are in millions of US dollar.
- The SIPRI Top 100 arms-producing and military services companies in the world (excluding China), 2005
| Rank (2005) | Company | Country | Arms Sales (2005) | Total Sales (2005) | Arms sales as a % of total sales (2005) | Arms sales 2005 (constant 2017 prices) |
|---|---|---|---|---|---|---|
| 1 | Boeing | United States | 29,590 | 54,845 | 54 | 37,131.221 |
| 2 | Lockheed Martin Corp. | United States | 26,200 | 37,213 | 70 | 32,877.255 |
| 3 | Northrop Grumman Corp. | United States | 23,330 | 30,721 | 76 | 29,275.815 |
| 4 | BAE Systems | United Kingdom | 23,230 | 28,020 | 83 | 21,662.482 |
| 5 | General Dynamics Corp. | United States | 16,570 | 21,244 | 78 | 20,792.982 |
| 6 | Raytheon | United States | 16,120 | 21,894 | 74 | 20,228.296 |
| 7 | EADS | Trans-European | 9,580 | 42,545 | 23 | 10,128.876 |
| 8 | Thales | France | 8,940 | 12,765 | 70 | 9,346.49 |
| 9 | Finmeccanica | Italy | 8,770 | 14,265 | 61 | 9,506.247 |
| 10 | L-3 Communications | United States | 8,470 | 10,195 | 83 | 10,628.639 |
- Figures for arms sales, total sales and profit are in millions of US dollar.
- The SIPRI Top 100 arms-producing and military services companies in the world (excluding China), 2004
| Rank (2004) | Company | Country | Arms Sales (2004) | Total Sales (2004) | Arms sales as a % of total sales (2004) | Arms sales 2004 (constant 2017 prices) |
|---|---|---|---|---|---|---|
| 1 | Boeing | United States | 28,980 | 52,457 | 55 | 37,599.556 |
| 2 | Lockheed Martin Corp. | United States | 26,150 | 35,526 | 74 | 33,927.826 |
| 3 | Northrop Grumman Corp. | United States | 22,160 | 29,853 | 74 | 28,751.075 |
| 4 | BAE Systems | United Kingdom | 19,840 | 24,687 | 80 | 18,749.371 |
| 5 | General Dynamics Corp. | United States | 15,150 | 19,178 | 79 | 19,656.083 |
| 6 | Raytheon | United States | 14,970 | 20,245 | 74 | 19,422.545 |
| 7 | EADS | Trans-European | 9,470 | 39,455 | 24 | 10,192.684 |
| 8 | Thales | France | 8,950 | 12,780 | 70 | 9,534.082 |
| 9 | Finmeccanica | Italy | 7,960 | 11,661 | 68 | 8,814.345 |
| 10 | United Technologies Corp. | United States | 6,740 | 37,445 | 18 | 8,744.686 |
- Figures for arms sales, total sales and profit are in millions of US dollar.
- The SIPRI Top 100 arms-producing and military services companies in the world (excluding China), 2003
| Rank (2003) | Company | Country | Arms Sales (2003) | Total Sales (2003) | Arms sales as a % of total sales (2003) | Arms sales 2003 (constant 2017 prices) |
|---|---|---|---|---|---|---|
| 1 | Boeing | United States | 25,870 | 50,485 | 51 | 34,463.147 |
| 2 | Lockheed Martin Corp. | United States | 24,910 | 31,824 | 78 | 33,184.267 |
| 3 | Northrop Grumman Corp. | United States | 20,310 | 26,396 | 77 | 27,056.301 |
| 4 | BAE Systems | United Kingdom | 15,760 | 20,543 | 77 | 16,925.934 |
| 5 | Raytheon | United States | 13,140 | 18,109 | 73 | 17,504.668 |
| 6 | General Dynamics Corp. | United States | 13,100 | 16,617 | 79 | 17,451.381 |
| 7 | Thales | France | 8,350 | 11,929 | 70 | 9,994.799 |
| 8 | EADS | Trans-European | 8,010 | 34,010 | 24 | 9,665.01 |
| 9 | United Technologies Corp. | United States | 6,210 | 31,034 | 20 | 8,272.754 |
| 10 | Finmeccanica | Italy | 5,300 | 9,758 | 54 | 6,599.745 |
- Figures for arms sales, total sales and profit are in millions of US dollar.
- The SIPRI Top 100 arms-producing and military services companies in the world (excluding China), 2002
| Rank (2002) | Company | Country | Arms Sales (2002) | Arms sales 2002 (constant prices 2017) | Total Sales (2002) | Arms sales as a % of total sales (2002) |
|---|---|---|---|---|---|---|
| 1 | Boeing | United States | 23,560 | 32,098.331 | 54,069 | 44 |
| 2 | Northrop Grumman Corp. | United States | 21,000 | 28,610.567 | 22,652 | 93 |
| 3 | Lockheed Martin Corp. | United States | 18,870 | 25,708.638 | 26,578 | 71 |
| 4 | BAE Systems | United Kingdom | 14,070 | 16,686.078 | 18,233 | 77 |
| 5 | Raytheon | United States | 12,020 | 16,376.143 | 16,760 | 72 |
| 6 | General Dynamics Corp. | United States | 9,820 | 13,378.846 | 13,829 | 71 |
| 7 | Thales | France | 6,840 | 10,025.537 | 10,451 | 65 |
| 8 | United Technologies Corp. | United States | 5,640 | 7,683.981 | 28,212 | 20 |
| 9 | EADS | Trans-European | 5,630 | 8,274.365 | 28,129 | 20 |
| 10 | Honeywell International | United States | 3,720 | 5,068.158 | 22,274 | 17 |
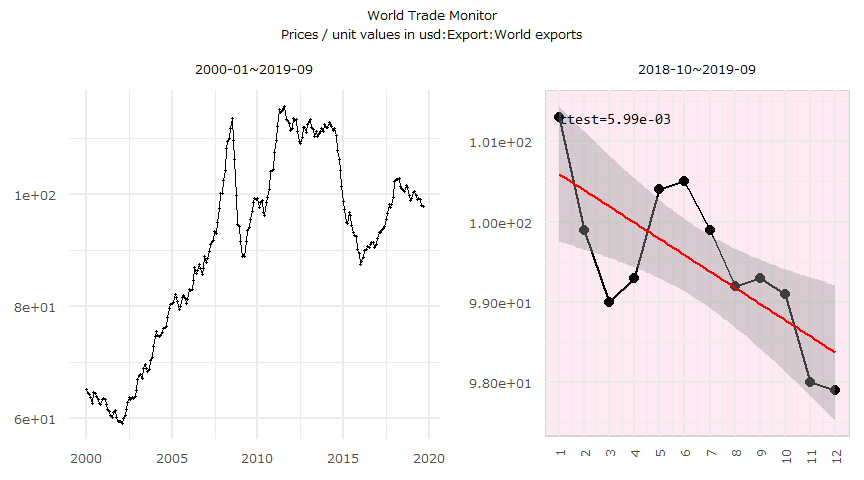
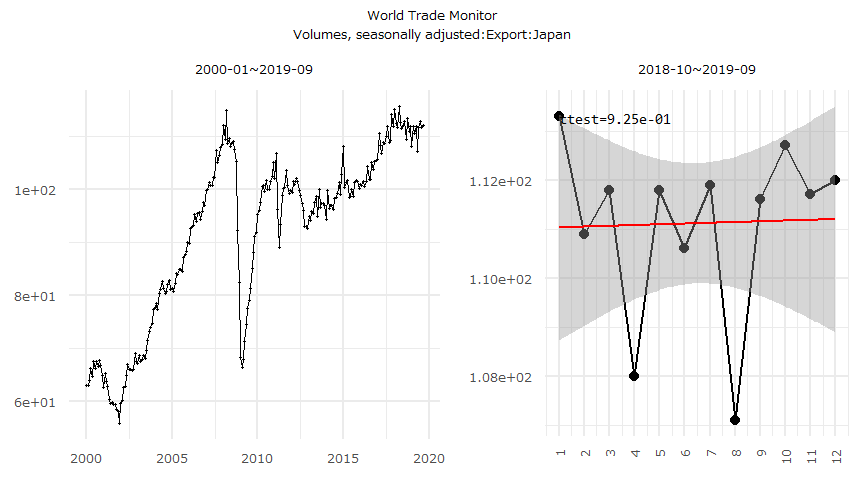
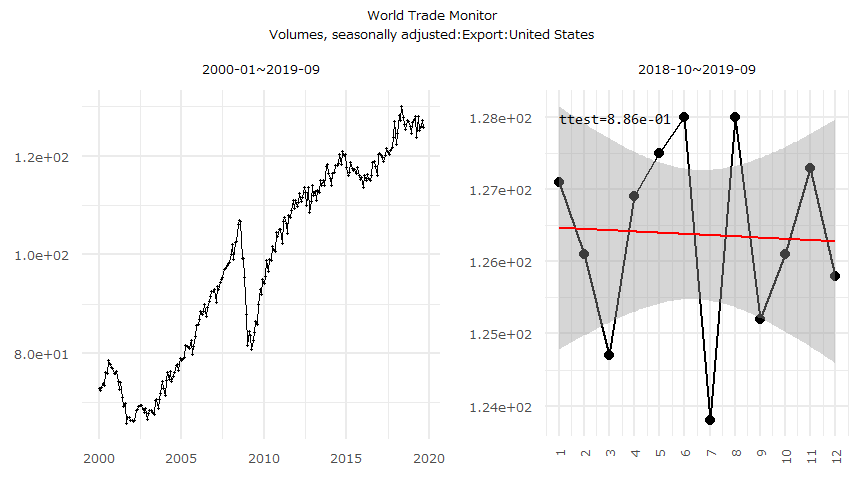
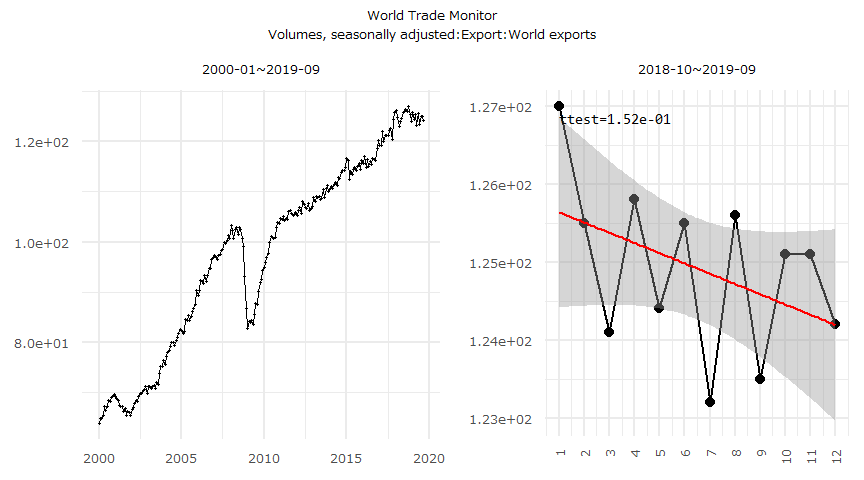
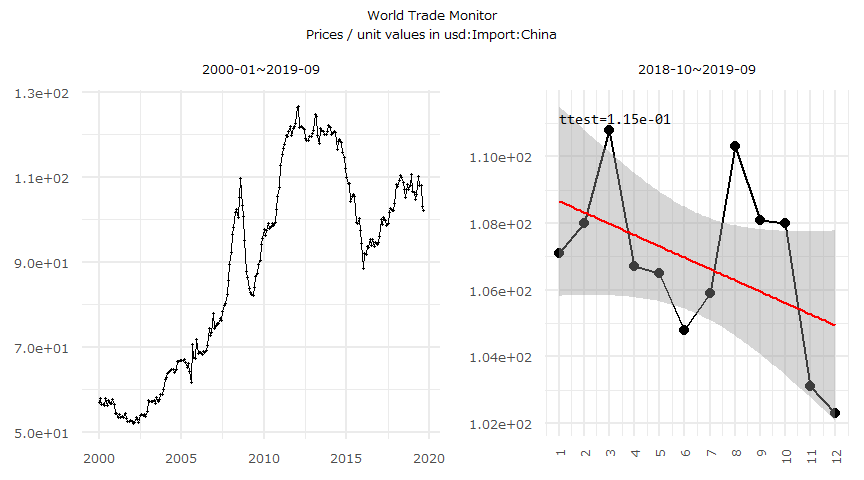
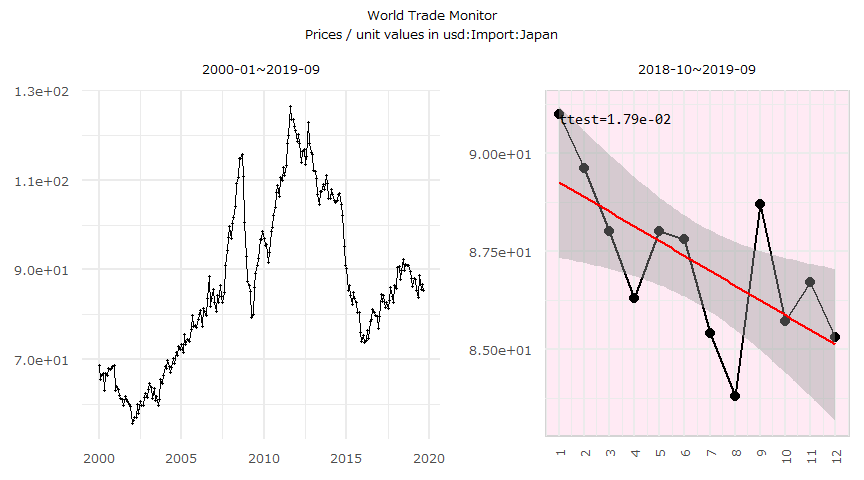
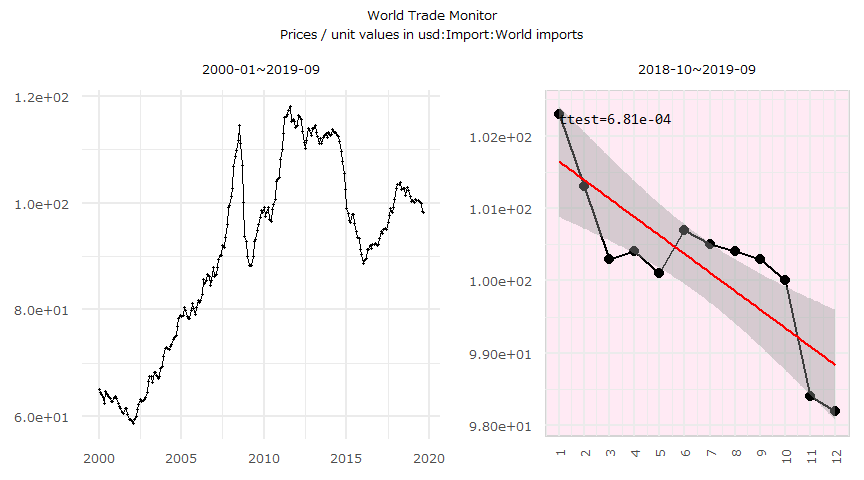
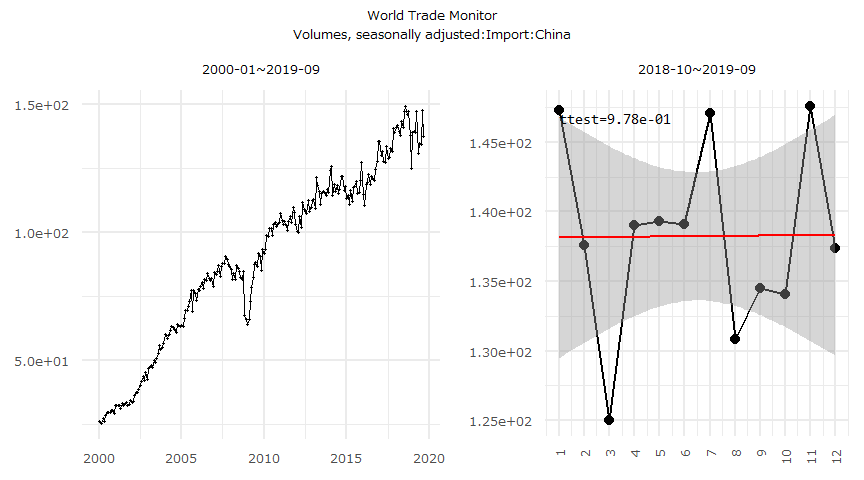
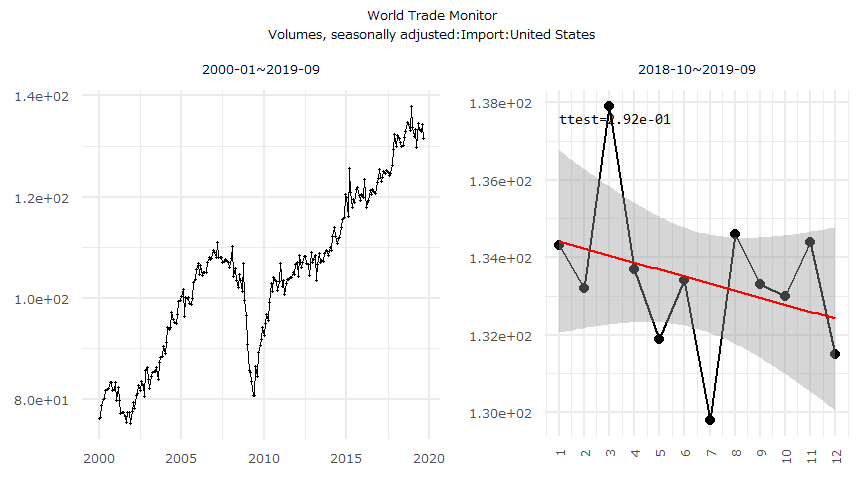
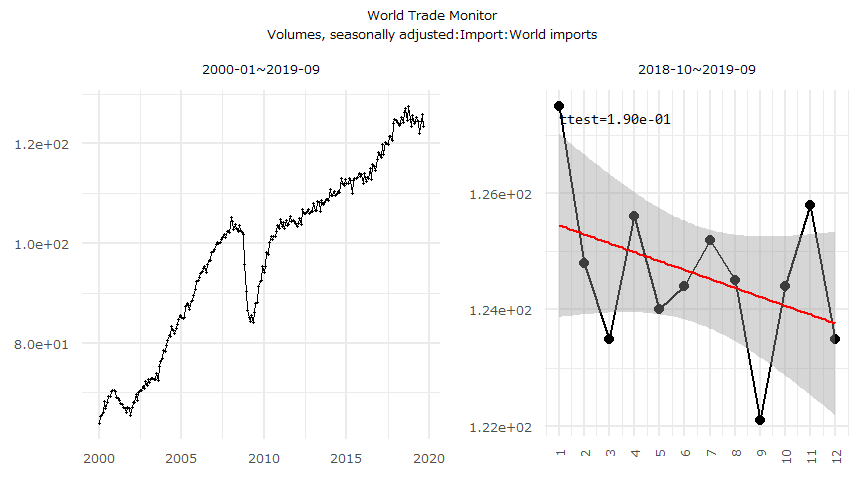
世界貿易モニター
- Source: CPB Netherlands Bureau for Economic Policy Analysis
Export


Import


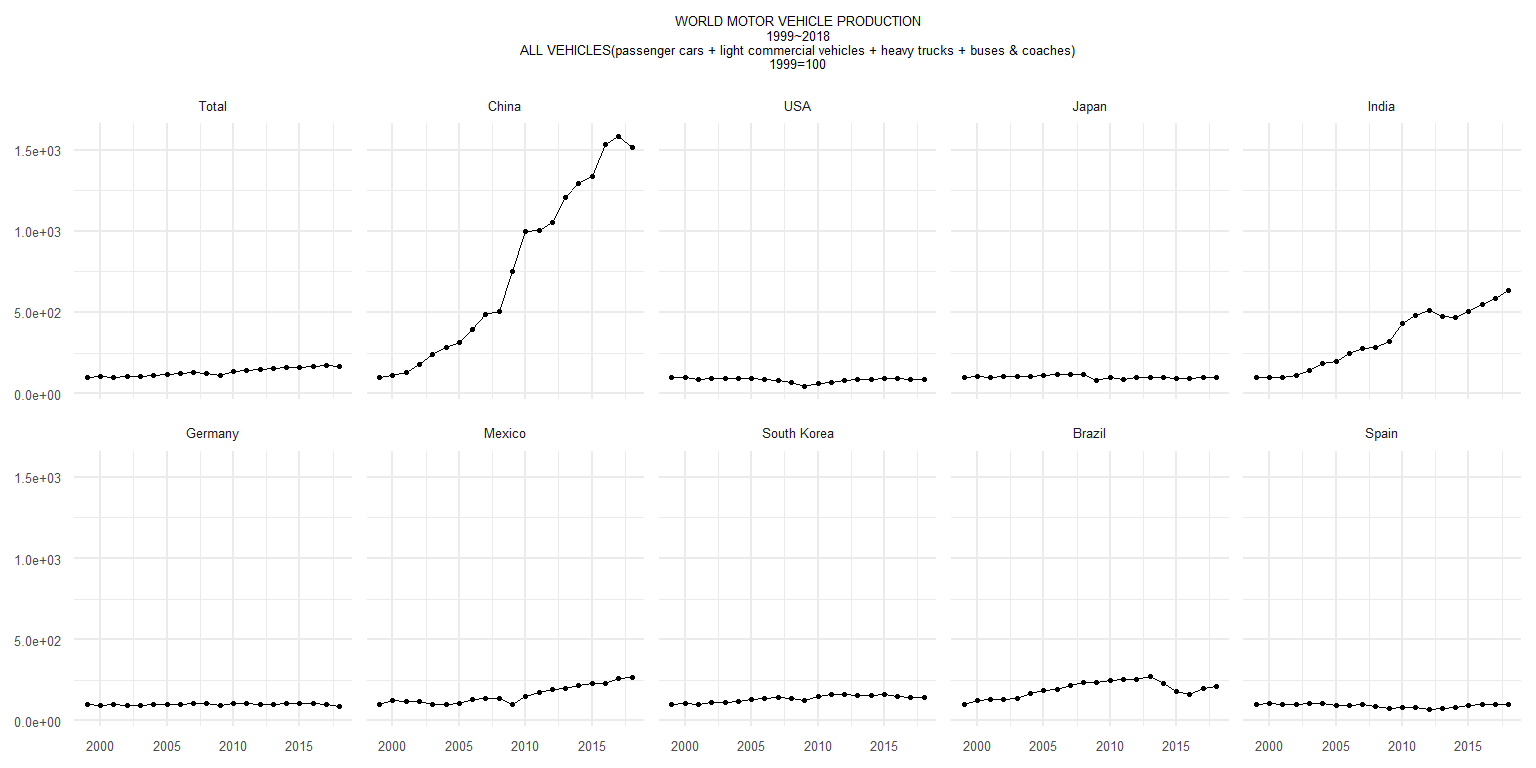
世界各国の自動車生産台数
- Source: OICA International Organization of Motor Vehicle Manufacturers
- ALL VEHICLES(passenger cars + light commercial vehicles + heavy trucks + buses & coaches)
| DATE | 2018 | 2017 | 2016 | 2015 | 2014 | 2013 | 2012 | 2011 |
|---|---|---|---|---|---|---|---|---|
| Total | 95,634,593 | 97,302,534 | 94,976,569 | 90,780,583 | 89,776,465 | 87,595,998 | 84,236,171 | 79,880,920 |
| China | 27,809,196 | 29,015,434 | 28,118,794 | 24,503,326 | 23,731,600 | 22,116,825 | 19,271,808 | 18,418,876 |
| USA | 11,314,705 | 11,189,985 | 12,198,137 | 12,100,095 | 11,660,702 | 11,066,432 | 10,335,765 | 8,661,535 |
| Japan | 9,728,528 | 9,693,746 | 9,204,590 | 9,278,238 | 9,774,665 | 9,630,181 | 9,943,077 | 8,398,630 |
| India | 5,174,645 | 4,782,896 | 4,488,965 | 4,125,744 | 3,844,857 | 3,898,425 | 4,174,713 | 3,927,411 |
| Germany | 5,120,409 | 5,645,581 | 6,062,562 | 6,033,164 | 5,907,548 | 5,718,222 | 5,649,260 | 6,146,948 |
| Mexico | 4,100,525 | 4,068,415 | 3,597,462 | 3,565,469 | 3,368,010 | 3,054,849 | 3,001,814 | 2,681,050 |
| South Korea | 4,028,834 | 4,114,913 | 4,228,509 | 4,555,957 | 4,524,932 | 4,521,429 | 4,561,766 | 4,657,094 |
| Brazil | 2,879,809 | 2,699,672 | 2,156,356 | 2,429,463 | 3,146,386 | 3,712,380 | 3,402,508 | 3,407,861 |
| Spain | 2,819,565 | 2,848,335 | 2,885,922 | 2,733,201 | 2,402,978 | 2,163,338 | 1,979,179 | 2,373,329 |

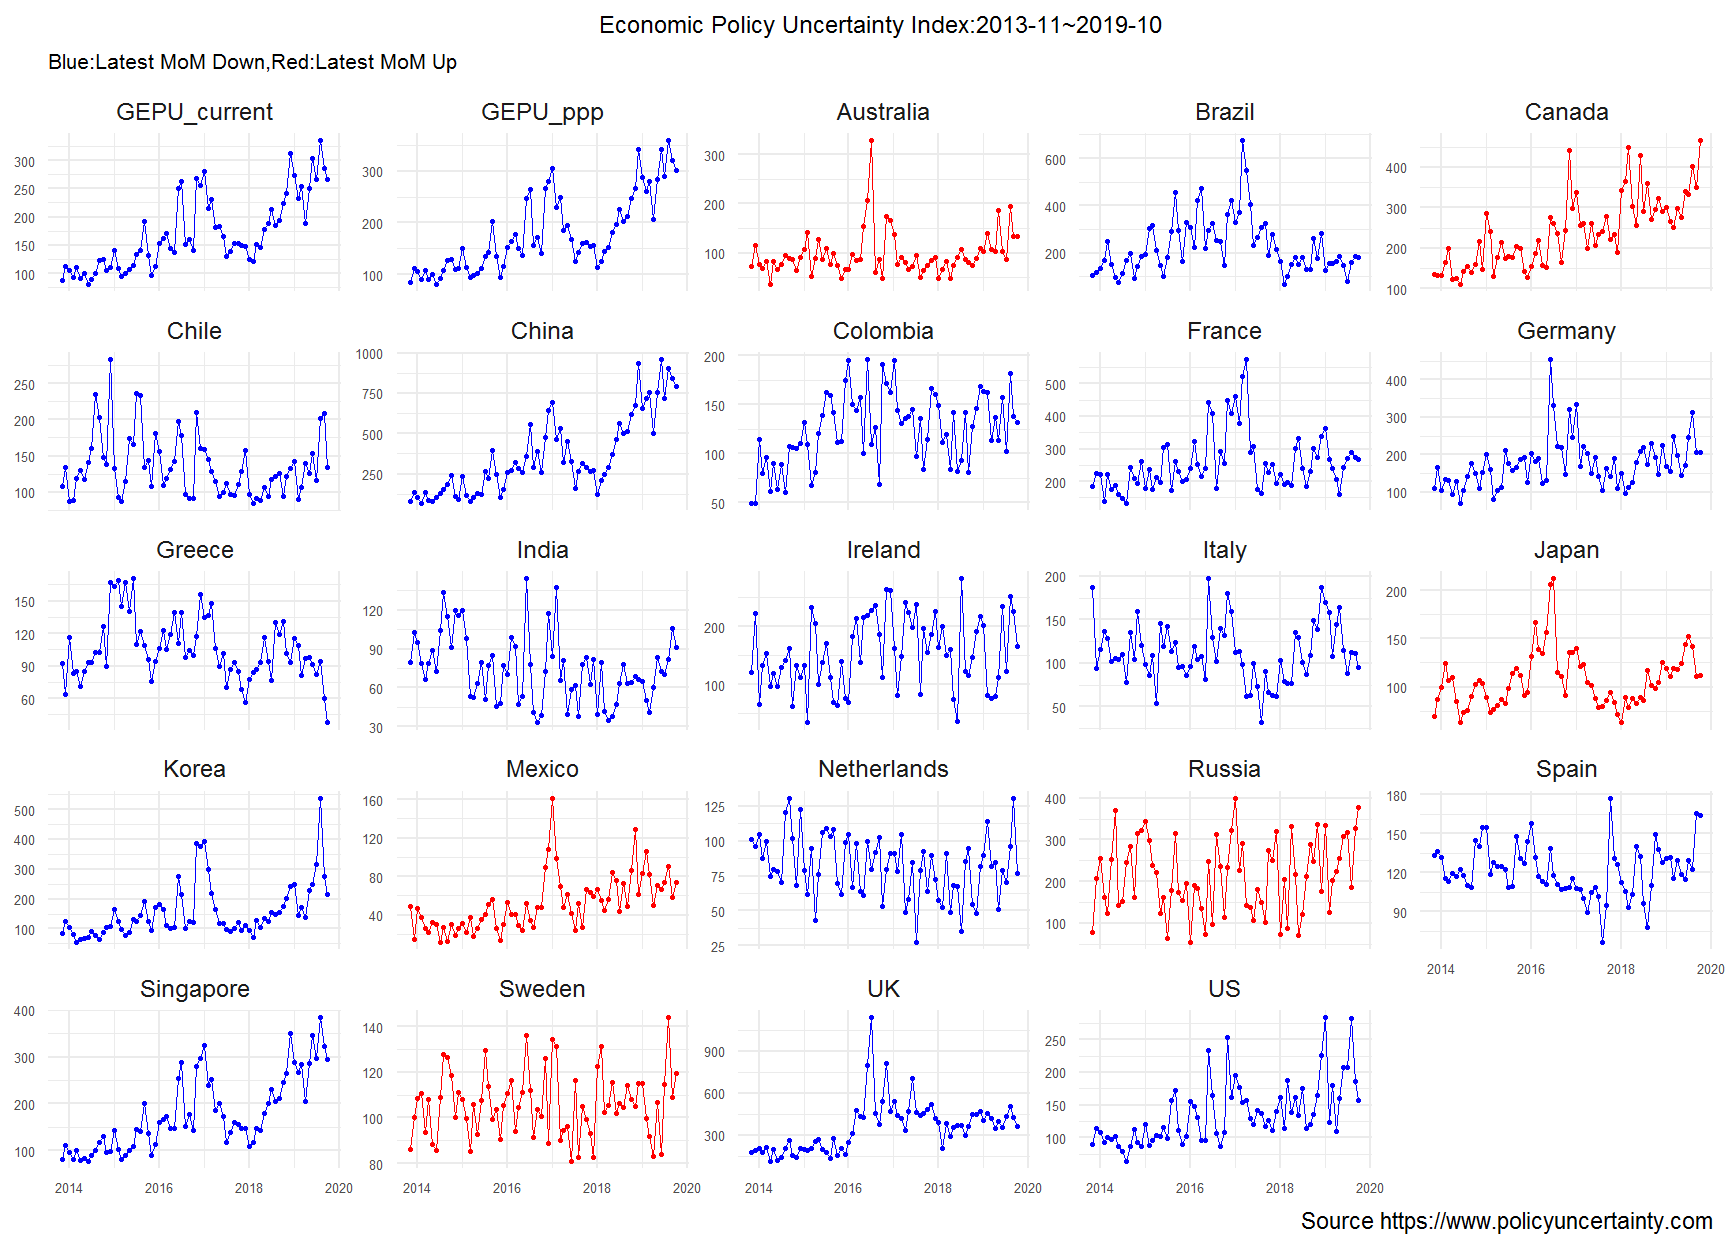
Economic Policy Uncertainty
経済指標同士の相関